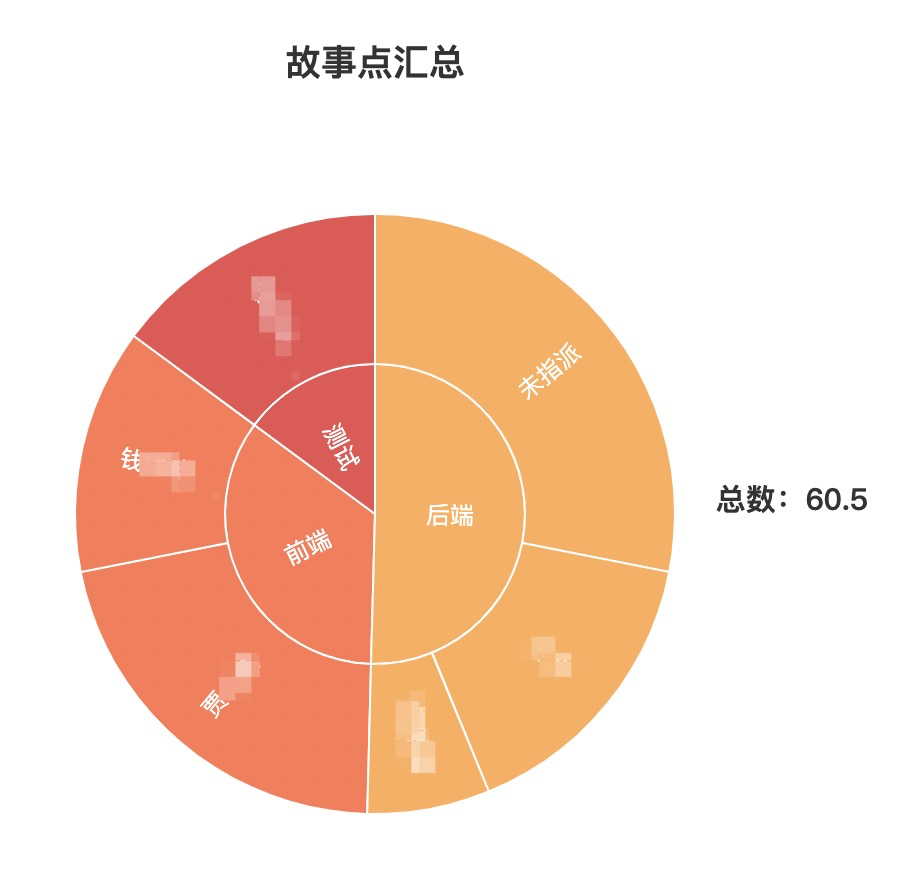
想用一张图来展示一个冲刺中每个人分配的故事点数,而且能够按照前端、后端、测试等维度聚合,所以采用了旭日图
效果如下
echarts中关于旭日图的例子:https://echarts.apache.org/examples/zh/editor.html?c=sunburst-simple
下面来介绍下具体实现过程
首先来看下旭日图的数据结构
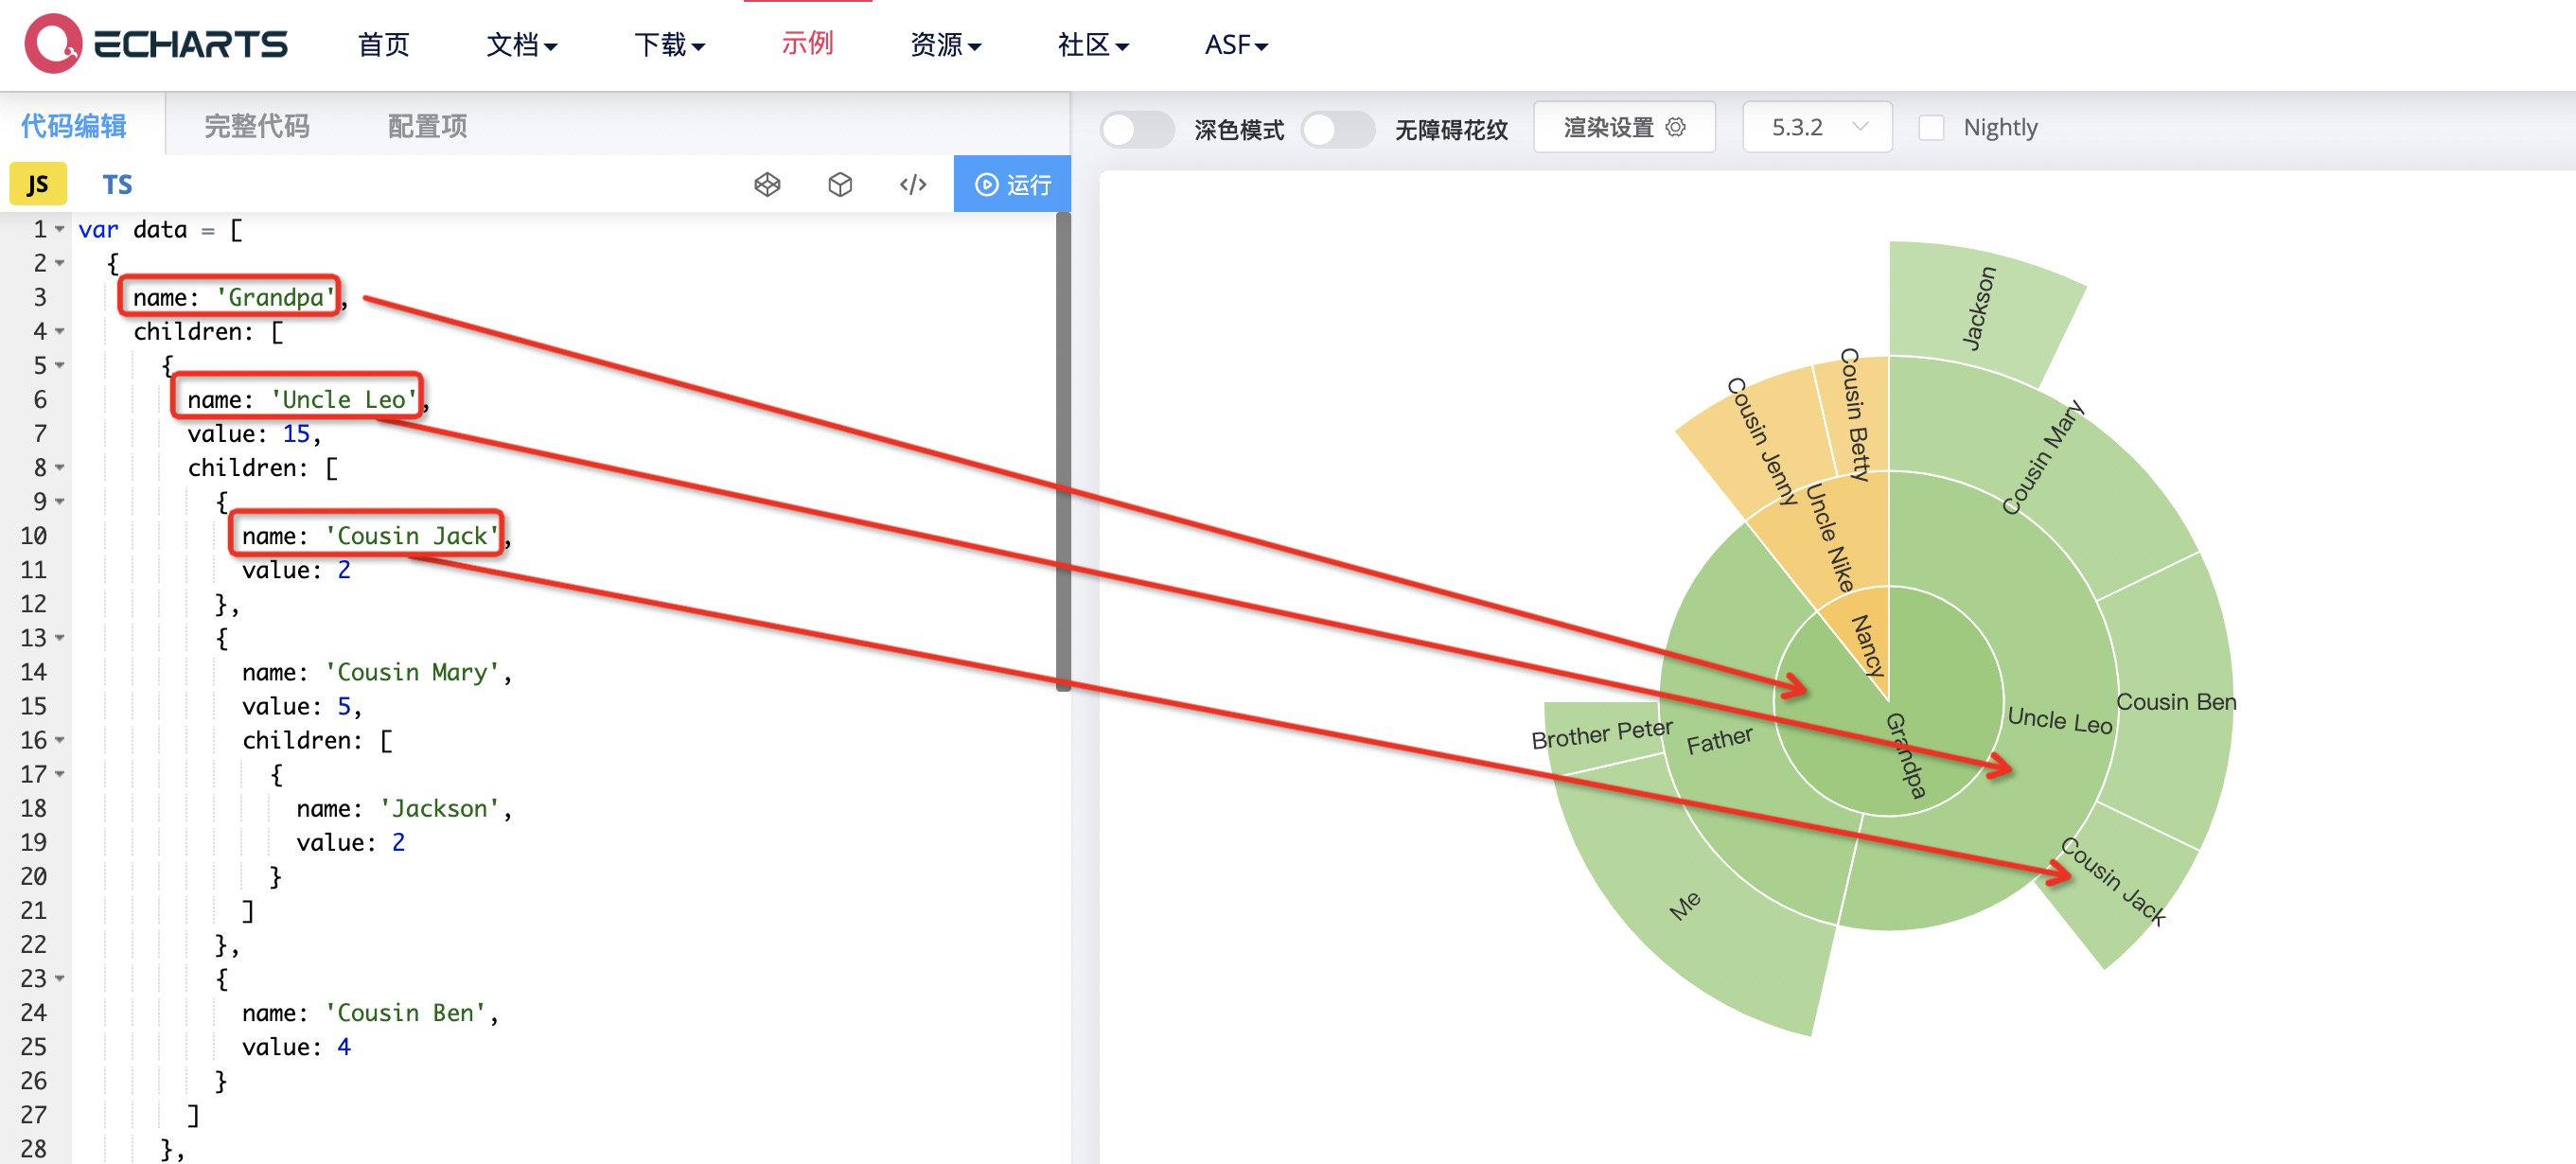
类似这种:父节点Grandpa,它下面有2个子节点Uncle Leo和Father,Uncle Leo下有3个子节点Cousin Jack、Cousin Mary、Cousin Ben
所以后端要构造出这种格式的数据
后端数据处理
可以从jira一个故事卡的原始数据中提取出 (前端工程师 and 前端故事点)、(后端工程师 and 后端故事点)、(测试负责人 and 测试故事点)
由于每个公司的jira版本不同,上述字段在自己当前jira中对应的字段属性不尽相同,需要自己从原始数据中找到对应字段名
下面是部分重点代码
    def get_sprint(self, project, sprint):
        """
        获取每个冲刺的数据,例如冲刺标题、每个人的故事点数
        :param project:
        :param sprint:
        :return:
        """

        try:
if sprint == "" or sprint is None:  # 不传sprint会查询所有冲刺
                jql = "project in ({}) AND issuetype = Story".format(project)
            else:
                jql = "project in ({}) AND issuetype = Story AND Sprint in ({})".format(project, sprint)

            print("****************** 打印jql ******************")
            print("正在执行的jql=", jql)

            fields = "summary, priority, status, creator, created, customfield_12309, customfield_12307," \
                     "customfield_12310, customfield_12308, customfield_12400,customfield_11303, customfield_10006"

            issues = self.jira.search_issues(jql, fields=fields, maxResults=-1)
            # 前端故事点:customfield_12309;后端故事点:customfield_12310;测试故事点:customfield_12400;预估总点数:customfield_10006
            # 前端负责人:customfield_12307;后端负责人:customfield_12308;测试负责人:customfield_11303

            front_points = []  # 前端故事点
            fronter = []  # 故事对应的前端工程师
            server_points = []  # 后端故事点
            server = []  # 故事对应的后端工程师
            test_points = []  # 测试故事点
            tester = []  # 故事对应的测试工程师

            for i in issues:

                # print(i.raw)  # 打印每个故事的原始信息
                # 前端故事点
                if i.raw["fields"]["customfield_12309"] is None:
                    front_points.append(0)
                else:
                    front_points.append(i.raw["fields"]["customfield_12309"])

                # 前端工程师
                if i.raw["fields"]["customfield_12307"] is None:
                    fronter.append("未指派")
                else:
                    fronter.append(i.raw["fields"]["customfield_12307"][0]["displayName"].split("(")[0])

                # 后端故事点
                if i.raw["fields"]["customfield_12310"] is None:
                    server_points.append(0)
                else:
                    server_points.append(i.raw["fields"]["customfield_12310"])

                # 后端工程师
                if i.raw["fields"]["customfield_12308"] is None:
                    server.append("未指派")
                else:
                    server.append(i.raw["fields"]["customfield_12308"][0]["displayName"].split("(")[0])

                # 测试故事点
                if i.raw["fields"]["customfield_12400"] is None:
                    test_points.append(0)
                else:
                    test_points.append(i.raw["fields"]["customfield_12400"])

                # 测试工程师
                if i.raw["fields"]["customfield_11303"] is None:
                    tester.append("未指派")
                else:
                    tester.append(i.raw["fields"]["customfield_11303"]["displayName"].split("(")[0])  # 提取名称,只保留中文

            print("打印前端故事点:", front_points)
            print("打印前端工程师:", fronter)
            # print("打印后端故事点:", server_points)
            # print("打印后端工程师:", server)
            # print("打印测试故事点:", test_points)
            # print("打印测试工程师:", tester)

            # 对前端、后端、测试各自的故事点数,以负责人维度进行聚合
            df1 = pd.DataFrame(data={'name': fronter, 'value': front_points})
            # groupby()之后,使用sum对相同元素求和 <class 'pandas.core.frame.DataFrame'>
            front_group = df1.groupby('name', as_index=True).sum()
            # print(front_group)

            front_dict = front_group.to_dict()["value"]
            front_list = self.data_to_pie(front_dict)  # 前端故事点旭日图所需数据
            print("打印前端故事点聚合数据", front_list)

            df2 = pd.DataFrame(data={'name': server, 'value': server_points})
            server_group = df2.groupby('name', as_index=True).sum()
            server_dict = server_group.to_dict()["value"]
            server_list = self.data_to_pie(server_dict)  # 后端故事点旭日图所需数据
            # print("打印后端故事点聚合数据", server_list)

            df3 = pd.DataFrame(data={'name': tester, 'value': test_points})
            tester_group = df3.groupby('name', as_index=True).sum()
            tester_dict = tester_group.to_dict()["value"]
            tester_list = self.data_to_pie(tester_dict)  # 测试故事点旭日图所需数据
            # print("打印测试故事点聚合数据", tester_list)

            points_total = sum(front_points + server_points + test_points)  # 前后端、测试故事点总数
            # print("打印故事点总数:", points_total)

            # 旭日图所需数据格式
            story_points_list = [
                {
                    "name": "前端",
                    "children": front_list
                },
                {
                    "name": "后端",
                    "children": server_list
                },
                {
                    "name": "测试",
                    "children": tester_list
                }
            ]


            res = {
                "code": "200",
                "points_total": points_total,
                "story_points_list": story_points_list,
            }
            return res

        except Exception as e:
            raise e
以前端为例,分别打印 front_points、fronter、front_list
print("打印前端故事点:", front_points)
print("打印前端工程师:", fronter)
print("打印前端故事点聚合数据front_list", front_list)
结果如下:
打印前端故事点: [1.0, 2.0, 1.0, 1.0, 2.0, 2.0, 0, 0, 0, 1.0, 3.0, 1.0]  每个故事卡的前端故事点
打印前端工程师: ['张三', '张三', '张三', '张三', '张三', '李四', '未指派', '未指派', '未指派', '李四', '李四', '李四'] 每个故事卡对应的前端工程师
打印前端故事点聚合数据front_list [{'value': 0.0, 'name': '未指派'}, {'value': 7.0, 'name': '李四'}, {'value': 7.0, 'name': '张三'}]  聚合上面2个列表,得到这样一组聚合数据
借助pandas处理front_points和fronter可以得到front_list
具体用法可以查看之前的一篇博客:质量看板开发实践(三):bug柱状图
同理可以得到后端工程师和测试负责人相关的数据,最后构造为旭日图所需的数据结构
# 旭日图所需数据格式
  story_points_list = [
      {
          "name": "前端",
          "children": front_list
      },
      {
          "name": "后端",
          "children": server_list
      },
      {
          "name": "测试",
          "children": tester_list
      }
  ]
前端处理
前端逻辑比较简单,只要把旭日图相关代码拿过来就好
<template>

</template>

<script>
import * as echarts from 'echarts';

export default {
  name: "sun_figure",
  methods: {
    story_sun(datasource, points) {

      let chartDom = document.getElementById('story_sun');
      let myChart = echarts.init(chartDom);
      let option;

      option = {
        title: {
          text: '故事点汇总',
          top: '5%', // 距离顶部位置
          left: 'center'
        },
        tooltip: {
          trigger: 'item'
        },
        color: ['#FFAE57', '#FF7853', '#EA5151', '#CC3F57', '#9A2555'],
        graphic: {
          type: 'text',
          left: "80%",
          top: '50%',
          style: {
            text: '总数:' + points,
            textAlign: 'center',
            fill: '#333',
            fontSize: 15,
            fontWeight: 700
          }
        },
        series: {
          type: 'sunburst',
          // emphasis: {
          //     focus: 'ancestor'
          // },
          center:['50%', '53%'], //控制左右上下
          data: datasource,
          radius: [0, '60%'], //控制大小
          label: {
            rotate: 'radial'
          }
        }
      };

      option && myChart.setOption(option);

    }
  }
}
</script>

<style scoped>

</style>