前言
leaflet 入门开发系列环境知识点了解:
- leaflet api文档介绍,详细介绍 leaflet 每个类的函数以及属性等等
- leaflet 在线例子
- leaflet 插件,leaflet 的插件库,非常有用
内容概览
leaflet快速渲染聚合矢量瓦片
源代码demo下载
录制演示视频
效果图如下:
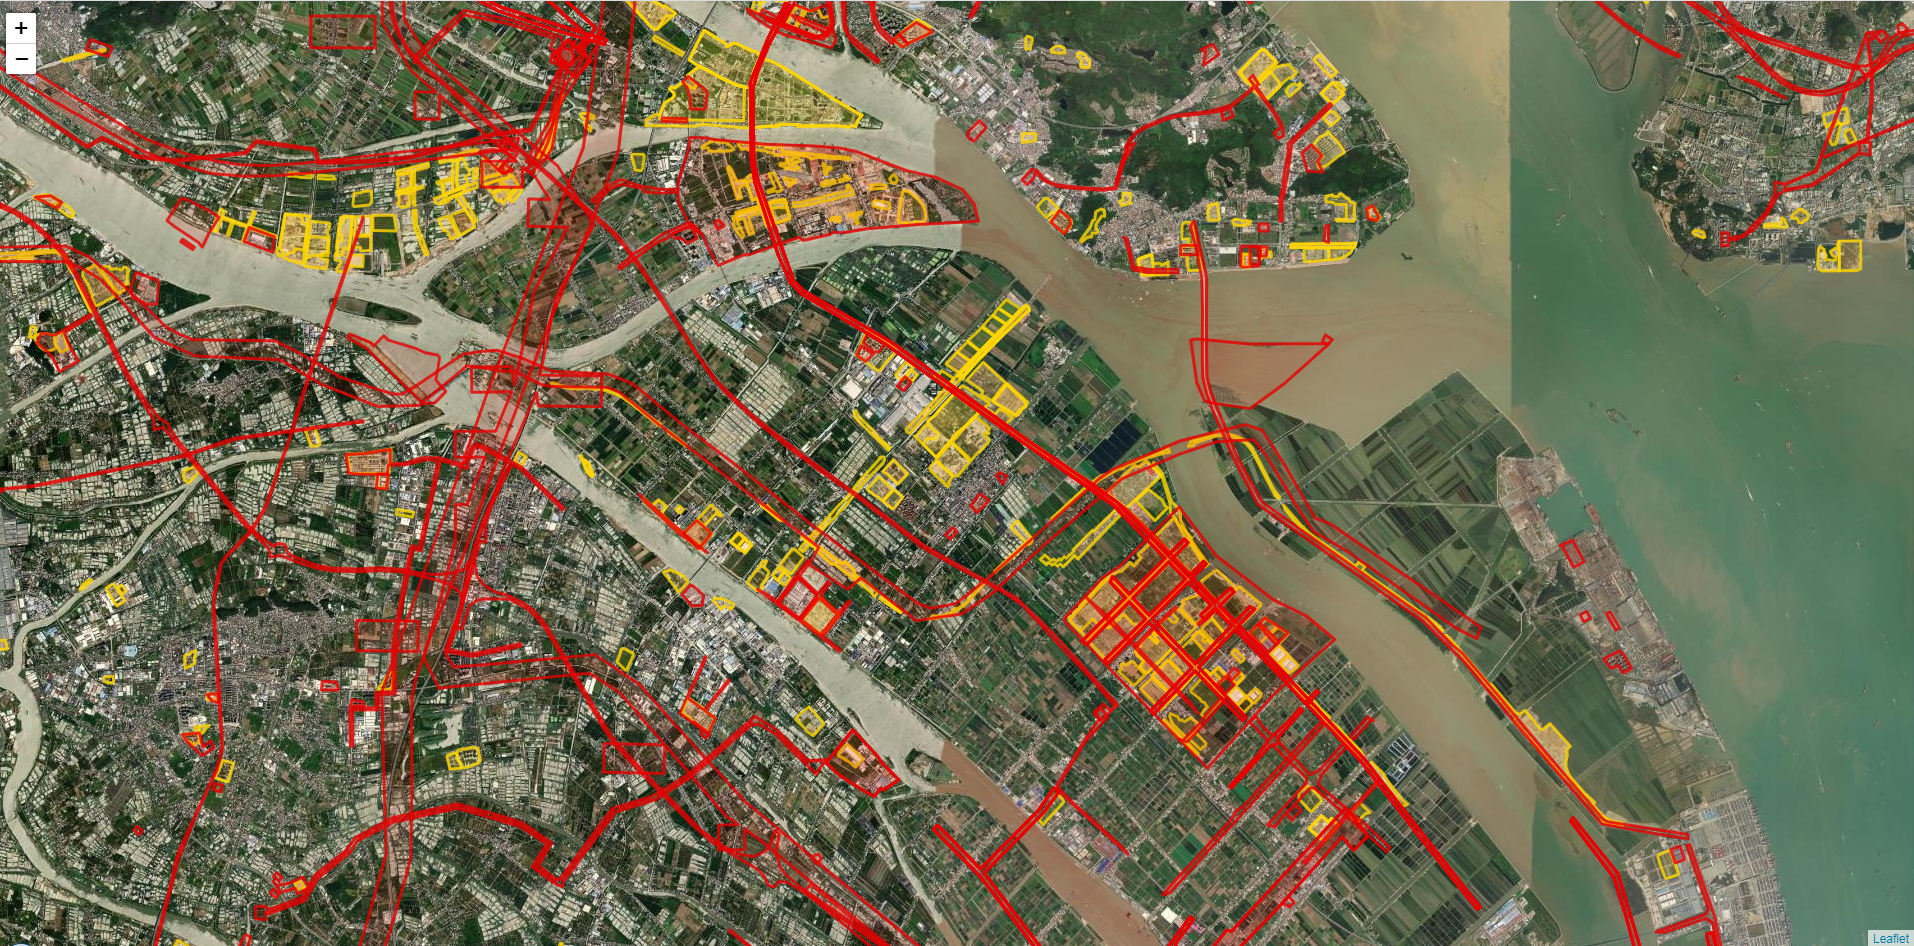
具体实现思路:leaflet结合Web Worker技术,借助supercluster插件,实现leaflet快速展示聚合效果。矢量瓦片请求数据源部分也放在Worker线程来处理,避免阻塞主线程UI交互部分响应。
测试数据:聚合点23.8w,矢量瓦片数据源15w左右。
引用关键技术点:
1.Web Worker:Web Worker的作用,就是为JavaScript创造多线程环境,允许主线程创建Worker线程,将一些任务分配给后者运行。在主线程运行的同时,Worker线程在后台运行,两者互不干扰。等到 Worker 线程完成计算任务,再把结果返回给主线程。这样的好处是,一些计算密集型或高延迟的任务,被Worker线程负担了,主线程(通常负责 UI 交互)就会很流畅,不会被阻塞或拖慢。
2.supercluster插件:supercluster插件
- 完整的见源码demo下载,聚合效果实现部分思路:
1.supercluster插件把聚合点数据源预处理,按照矢量瓦片思路提前把聚合点数据源切片处理好,每个级别对应的聚合点数以及对应数据源(zoom,count,data);
2.leaflet通过监听地图范围变化事件,主线程跟worker子线程之间互相通信交互,然后leaflet根据worker子线程返回来的数据源,动态刷新聚合数据。
主线程部分:
const markers = L.geoJson(null, {
pointToLayer: createClusterIcon
}).addTo(map);
var worker = new Worker('worker.js');
let ready = false;
worker.onmessage = function (e) {
if (e.data.ready) {
ready = true;
update();
} else if (e.data.expansionZoom) {
map.flyTo(e.data.center, e.data.expansionZoom);
} else {
markers.clearLayers();
markers.addData(e.data);
}
};

function update() {
if (!ready) return;
const bounds = map.getBounds();
worker.postMessage({
bbox: [bounds.getWest(), bounds.getSouth(), bounds.getEast(), bounds.getNorth()],
zoom: map.getZoom()
});
}
map.on('moveend', update);
function createClusterIcon(feature, latlng) {
if (!feature.properties.cluster) return L.marker(latlng);
const count = feature.properties.point_count;
const size =
count < 100 ? 'small' :
count < 1000 ? 'medium' : 'large';
const icon = L.divIcon({
html: `<div><span>${ feature.properties.point_count_abbreviated }</span></div>`,
className: `marker-cluster marker-cluster-${ size}`,
iconSize: L.point(40, 40)
});
return L.marker(latlng, {icon});
}
markers.on('click', (e) => {
if (e.layer.feature.properties.cluster_id) {
worker.postMessage({
getClusterExpansionZoom: e.layer.feature.properties.cluster_id,
center: e.latlng
});
}
});

worker线程部分:
importScripts('supercluster.min.js');
const now = Date.now();
let index;
//getJSON('../test/fixtures/places.json', (geojson) => {
getJSON('spotPoints.json', (geojson) => {
//console.log(`loaded ${ geojson.length } points JSON in ${ (Date.now() - now) / 1000 }s`);
console.log(`loaded ${ geojson.features.length } points JSON in ${ (Date.now() - now) / 1000 }s`);
index = new Supercluster({
log: true,
radius: 100,//60
extent: 256,
maxZoom: 17//17
}).load(geojson.features);
console.log(index.getTile(0, 0, 0));
postMessage({ready: true});
});
self.onmessage = function (e) {
if (e.data.getClusterExpansionZoom) {
postMessage({
expansionZoom: index.getClusterExpansionZoom(e.data.getClusterExpansionZoom),
center: e.data.center
});
} else if (e.data) {
postMessage(index.getClusters(e.data.bbox, e.data.zoom));
}
};
function getJSON(url, callback) {
const xhr = new XMLHttpRequest();
xhr.open('GET', url, true);
xhr.responseType = 'json';
xhr.setRequestHeader('Accept', 'application/json');
xhr.onload = function () {
if (xhr.readyState === 4 && xhr.status >= 200 && xhr.status < 300 && xhr.response) {
callback(xhr.response);
}
};
xhr.send();
}
- 完整的见源码demo下载,矢量瓦片实现部分思路:请求矢量数据源部分放在worker子线程处理,然后返回来leaflet主线程来矢量瓦片渲染可视化。
主线程:
//矢量瓦片
var vectorworker = new Worker('vectorGridworker.js');
vectorworker.onmessage = function (e) {
//vectorworker.terminate();
if (e.data.type == "spot") {//图斑
vectorGrid = L.vectorGrid.slicer(e.data.geojson, geojsonTileOptions).addTo(map);
}
else {//项目红线
vectorRedGrid = L.vectorGrid.slicer(e.data.geojson, geojsonRedTileOptions).addTo(map);
}
};
worker线程:
const now = Date.now();
let index;
//getJSON('../test/fixtures/places.json', (geojson) => {
getJSON('quanguoSpot.json', (geojson) => {
//console.log(`loaded ${ geojson.length } points JSON in ${ (Date.now() - now) / 1000 }s`);
console.log(`loaded ${ geojson.features.length } points JSON in ${ (Date.now() - now) / 1000 }s`);
postMessage({type:"spot",geojson:geojson});
});
getJSON('quanguoRedLine.json', (geojson) => {
//console.log(`loaded ${ geojson.length } points JSON in ${ (Date.now() - now) / 1000 }s`);
console.log(`loaded ${ geojson.features.length } points JSON in ${ (Date.now() - now) / 1000 }s`);
postMessage({type:"redline",geojson:geojson});
});
function getJSON(url, callback) {
const xhr = new XMLHttpRequest();
xhr.open('GET', url, true);
xhr.responseType = 'json';
xhr.setRequestHeader('Accept', 'application/json');
xhr.onload = function () {
if (xhr.readyState === 4 && xhr.status >= 200 && xhr.status < 300 && xhr.response) {
callback(xhr.response);
}
};
xhr.send();
}
完整demo源码见小专栏文章尾部:小专栏
文章尾部提供源代码下载,对本专栏感兴趣的话,可以关注一波