前言:openlayers6推出来的有一段时间,推出来的新特性见:https://github.com/openlayers/openlayers/releases/
该版本的主要功能是能够组合具有不同渲染器类型的图层。以前,地图只使用一种渲染策略,并且地图中的所有图层都必须实施该策略。现在,可以使用包含使用不同渲染技术的图层的地图。例如,这使得可以在同一地图中将Canvas(2D)图层与基于WebGL的图层组合在一起。也可以使用自定义渲染器创建图层。因此,您可以拥有一个使用另一个库(例如d3)的地图来渲染一个图层,并使用OpenLayers来渲染其他图层的地图。此外,6.0版还对矢量图块渲染进行了许多改进,并且总体上应该具有较低的内存占用量。WebGL抛弃了实验室阶段,正式成为图层,目前openlayers6.1.1版本有webgl点图层。
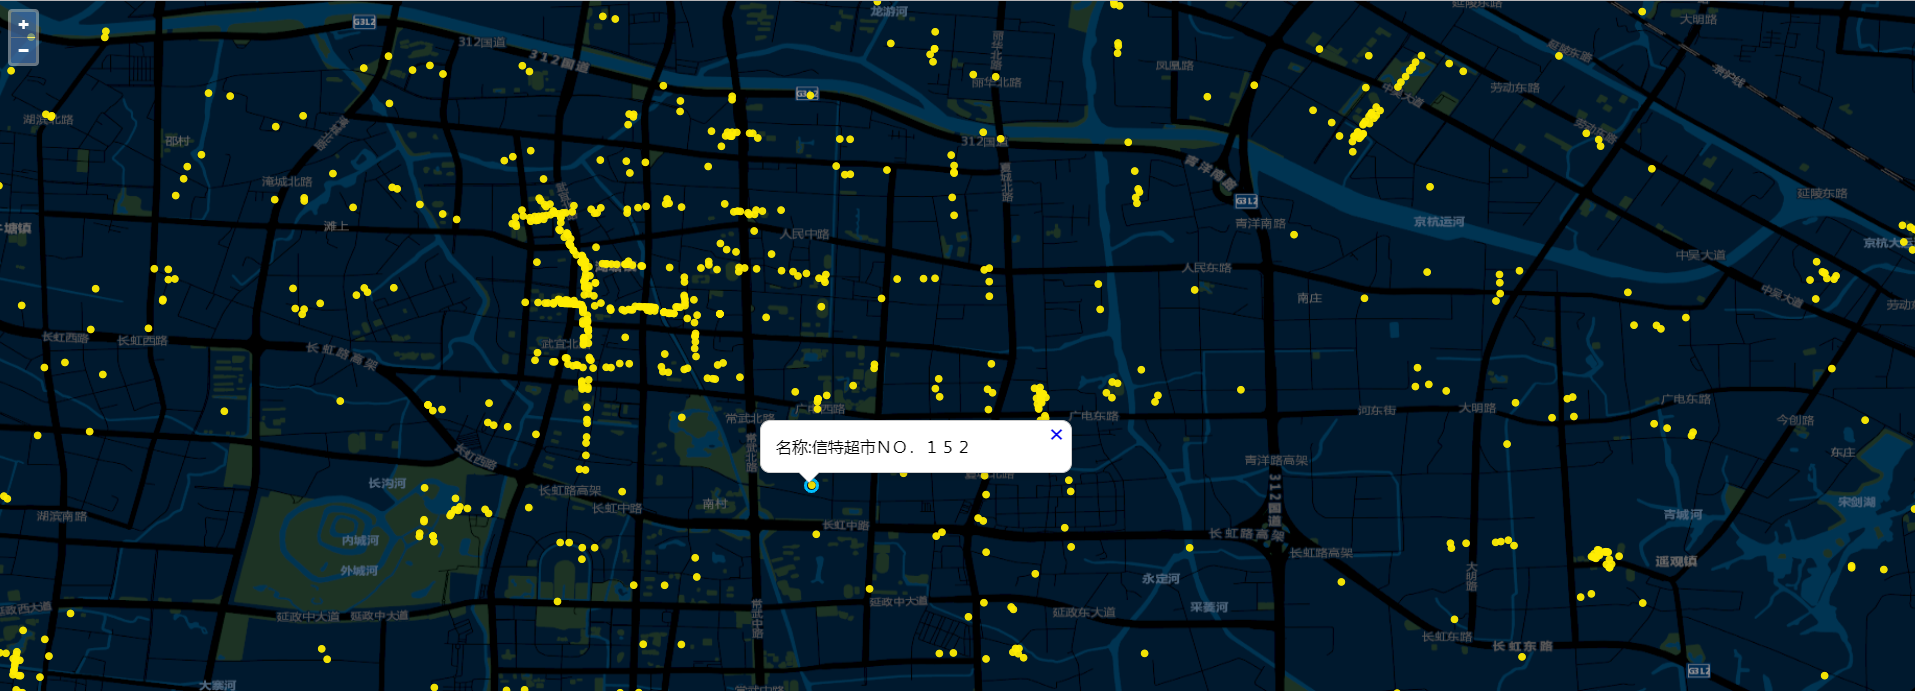
本文我是参照openlayers官网webgl点渲染例子,替换自己的数据源做的测试渲染例子,测试点图层77w左右个点,渲染效果还可以,体验问题不大。
内容概览
1.基于openlayers6实现webgl点图层渲染效果
2.源代码demo下载
效果图如下:
- 核心代码如下:
import {Map, View} from 'ol';
//import TileLayer from 'ol/layer/Tile';
import {Tile as TileLayer, Vector as VectorLayer} from 'ol/layer';
import XYZ from 'ol/source/XYZ';
import WebGLPointsLayer from 'ol/layer/WebGLPoints';
import GeoJSON from 'ol/format/GeoJSON';
import Vector from 'ol/source/Vector';
import {Circle as CircleStyle, Fill, Stroke, Style} from 'ol/style';
import Overlay from 'ol/Overlay';

var container = document.getElementById('popup');
var content = document.getElementById('popup-content');
var closer = document.getElementById('popup-closer');


var overlay = new Overlay({
element: container,
autoPan: true,
autoPanAnimation: {
duration: 250
}
});

closer.onclick = function() {
overlay.setPosition(undefined);
closer.blur();
clearGeojsonLayer();
return false;
};

var image = new CircleStyle({
radius: 6,
fill: null,
stroke: new Stroke({color: '#00BFFF',  3})
});
//绘制geojson矢量图层样式
var geoJsonStyle = new Style({
image: image
});
var geojsonLayer = new VectorLayer({
source: new Vector(),
style: geoJsonStyle
});


var map = new Map({
target: 'map',
layers: [
new TileLayer({
source: new XYZ({
//url: 'https://{a-c}.tile.openstreetmap.org/{z}/{x}/{y}.png'
url: 'http://cache1.arcgisonline.cn/arcgis/rest/services/ChinaOnlineStreetPurplishBlue/MapServer/tile/{z}/{y}/{x}'
})
}),
geojsonLayer
],
overlays: [overlay],
view: new View({
projection: 'EPSG:4326',
//center: [0, 0],
//zoom: 2
center: [106.8751, 33.3851],
zoom: 5
})
});

var vectorSource = new Vector({
url: 'data.json',
format: new GeoJSON()
});

var style = {
symbol: {
symbolType: 'circle',
//size: 5,
size: [
"interpolate",
[
"exponential",
2.5
],
[
"zoom"
],
2,
1,
12,
8,
16,
12
],
color: '#ffed02',
offset: [0, 0],
opacity: 0.95
}
};

var pointsLayer;
pointsLayer = new WebGLPointsLayer({
source: vectorSource,
style: style,
disableHitDetection: false //将此设置为true会稍微提高性能,但会阻止在图层上进行所有命中检测,需要交互的话,设置false
});
map.addLayer(pointsLayer);

map.on('singleclick',function(e) {
if (e.dragging) {
return;
}
var feature =map.forEachFeatureAtPixel(e.pixel,
function(feature) {
return feature;
});
console.log('feature',feature);
……
完整demo源码见小专栏文章尾部:小专栏
文章尾部提供源代码下载,对本专栏感兴趣的话,可以关注一波