import matplotlib.pyplot as plt
import math
import numpy as np
x = np.arange(-0.85,0.95,0.05)
    #获得函数结果
y1 = [math.log(1-a) for a in x]
    #画图
plt.plot(x, y1, linewidth=2, color='#007500', label='log1.5(x)')
plt.legend(loc='lower right')#在右下角显示计算用的函数
plt.grid(True)#在坐标系上画格子
    #打印图片
plt.show()
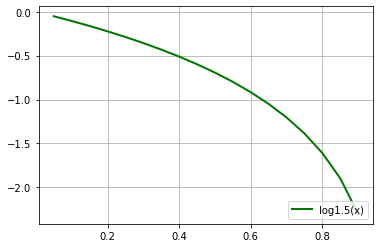
y = log(1-a)
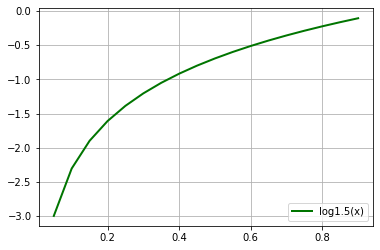
y = log(a)
import matplotlib.pyplot as plt
import math
import numpy as np
x = np.arange(-10,10,0.005)
    #获得函数结果
max = 10
min = -10


y1 = [math.log(1-(a-min)/(max-min)) for a in x]
    #画图
plt.plot(x, y1, linewidth=2, color='#007500', label='Minimax loss')

y2 = [-math.log((b+0.001-min)/(max-min)) for b in x]
    #画图
plt.plot(x, y2, linewidth=2, color='red', label='Non-saturating loss')

plt.xlabel("X",fontsize=14)
plt.ylabel("Loss",fontsize=14)
plt.legend(loc='top right')#在右下角显示计算用的函数
plt.grid(True)#在坐标系上画格子
    #打印图片
plt.show()

import matplotlib.pyplot as plt
import math
import numpy as np
x = np.arange(-10,10,0.005)
    #获得函数结果
max = 10
min = -10
x3 = np.arange(0.005,100,0.0005)
y3 = [-(a-min)/(max-min) for a in x]
plt.plot(x, y3, linewidth=2, color='blue', label='linear loss')
plt.xlabel("X",fontsize=14)
plt.ylabel("Loss",fontsize=14)
plt.legend(loc='top right')#在右下角显示计算用的函数
plt.grid(True)#在坐标系上画格子
    #打印图片
plt.show()
