背景
本文简单介绍下,Prometheus如何通过exporters监控Oracle数据库,以及应该注意哪些指标。
oracledb_exporter
oracledb_exporter是一个连接到Oracle数据库并生成Prometheus metrics的应用程序,
设置
展示下如何安装和设置oracledb_exporter,以使用Prometheus来监控Oracle数据库。oracledb_exporter部署在k8s集群中
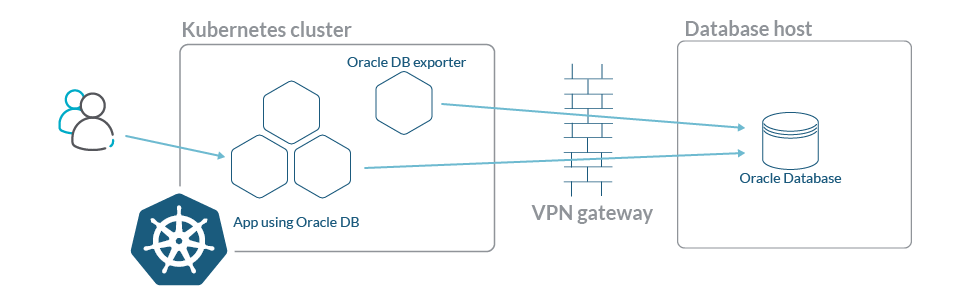
在k8s使用Deployment部署oracledb_exporter,并添加注解,以实现Prometheus自动发现oracledb_exporter断点并收集指标
spec:
 template:
   metadata:
     annotations:
       prometheus.io/scrape: "true"
       prometheus.io/port: "9161"
       prometheus.io/path: "/metrics"
oracledb_exporter需要Oracle的连接信息才能访问和生成指标,此参数作为环境变量传递到exporter。由于连接信息包含用于访问数据库的用户和密码,因此我们将使用Kubernetes Secret来存储它。
要创建到Oracle数据库的连接字符串的密码,可以使用以下命令:
kubectl create secret generic oracledb-exporter-secret
    --from-literal=datasource='YOUR_CONNECTION_STRING'
在deployment中,这样配置环境变量
       env:
       - name: DATA_SOURCE_NAME
         valueFrom:
           secretKeyRef:
             name: oracledb-exporter-secret
             key: datasource
要确保连接信息是否正确:
system/password@//database_url:1521/database_name.your.domain.com
可以使用 sqlplus docker镜像进行检测
docker run --net='host' --rm --interactive guywithnose/sqlplus sqlplus system/password@//database_url:1521/database_name.my.domain.com
下面添加一些自定义指标,包括慢查询(slow queries),错误查询(bug queries)
为了使用自定义指标:
- 在deployment中,我们将添加另一个环境变量,该变量具有到新指标的文件的路由。
- 从ConfigMap将此新文件挂载为volume
完整配置如下:
apiVersion: apps/v1
kind: Deployment
metadata:
  name: oracledb-exporter
  namespace: database-namespace
spec:
  selector:
    matchLabels:
      app: oracledb-exporter
  replicas: 1
  template:
    metadata:
      labels:
        app: oracledb-exporter
      annotations:
        prometheus.io/scrape: "true"
        prometheus.io/port: "9161"
        prometheus.io/path: "/metrics"
    spec:
      containers:
      - name: oracledb-exporter
        ports:
        - containerPort: 9161
        image: iamseth/oracledb_exporter
        env:
        - name: DATA_SOURCE_NAME
          valueFrom:
            secretKeyRef:
              name: oracledb-exporter-secret
              key: datasource
        - name: CUSTOM_METRICS
          value: /tmp/custom-metrics.toml
        volumeMounts:
          - name:  custom-metrics
            mountPath:  /tmp/custom-metrics.toml
            subPath: custom-metrics.toml
      volumes:
        - name: custom-metrics
          configMap:
            defaultMode: 420
            name: custom-metrics
ConfigMap:
apiVersion: v1
kind: ConfigMap
metadata:
  name: custom-metrics
  namespace: database-namespace
data:
  custom-metrics.toml: |
    [[metric]]
    context = "slow_queries"
    metricsdesc = { p95_time_usecs= "Gauge metric with percentile 95 of elapsed time.", p99_time_usecs= "Gauge metric with percentile 99 of elapsed time." }
    request = "select  percentile_disc(0.95)  within group (order by elapsed_time) as p95_time_usecs, percentile_disc(0.99)  within group (order by elapsed_time) as p99_time_usecs from v$sql where last_active_time >= sysdate - 5/(24*60)"
    [[metric]]
    context = "big_queries"
    metricsdesc = { p95_rows= "Gauge metric with percentile 95 of returned rows.", p99_rows= "Gauge metric with percentile 99 of returned rows." }
    request = "select  percentile_disc(0.95)  within group (order by rownum) as p95_rows, percentile_disc(0.99)  within group (order by rownum) as p99_rows from v$sql where last_active_time >= sysdate - 5/(24*60)"
    [[metric]]
    context = "size_user_segments_top100"
    metricsdesc = {table_bytes="Gauge metric with the size of the tables in user segments."}
    labels = ["segment_name"]
    request = "select * from (select segment_name,sum(bytes) as table_bytes from user_segments where segment_type='TABLE' group by segment_name) order by table_bytes DESC FETCH NEXT 100 ROWS ONLY"
    [[metric]]
    context = "size_user_segments_top100"
    metricsdesc = {table_partition_bytes="Gauge metric with the size of the table partition in user segments."}
    labels = ["segment_name"]
    request = "select * from (select segment_name,sum(bytes) as table_partition_bytes from user_segments where segment_type='TABLE PARTITION' group by segment_name) order by table_partition_bytes DESC FETCH NEXT 100 ROWS ONLY"
    [[metric]]
    context = "size_user_segments_top100"
    metricsdesc = {cluster_bytes="Gauge metric with the size of the cluster in user segments."}
    labels = ["segment_name"]
    request = "select * from (select segment_name,sum(bytes) as cluster_bytes from user_segments where segment_type='CLUSTER' group by segment_name) order by cluster_bytes DESC FETCH NEXT 100 ROWS ONLY"
    [[metric]]
    context = "size_dba_segments_top100"
    metricsdesc = {table_bytes="Gauge metric with the size of the tables in user segments."}
    labels = ["segment_name"]
    request = "select * from (select segment_name,sum(bytes) as table_bytes from dba_segments where segment_type='TABLE' group by segment_name) order by table_bytes DESC FETCH NEXT 100 ROWS ONLY"
    [[metric]]
    context = "size_dba_segments_top100"
    metricsdesc = {table_partition_bytes="Gauge metric with the size of the table partition in user segments."}
    labels = ["segment_name"]
    request = "select * from (select segment_name,sum(bytes) as table_partition_bytes from dba_segments where segment_type='TABLE PARTITION' group by segment_name) order by table_partition_bytes DESC FETCH NEXT 100 ROWS ONLY"
    [[metric]]
    context = "size_dba_segments_top100"
    metricsdesc = {cluster_bytes="Gauge metric with the size of the cluster in user segments."}
    labels = ["segment_name"]
    request = "select * from (select segment_name,sum(bytes) as cluster_bytes from dba_segments where segment_type='CLUSTER' group by segment_name) order by cluster_bytes DESC FETCH NEXT 100 ROWS ONLY"
创建Secret和ConfigMap之后,就可以应用Deployment并检查它是否正在从Oracle数据库的端口9161中获取指标。
如果一切正常,Prometheus将自动发现exporter带注释的pod,并在几分钟内开始抓取指标。可以在Prometheus Web界面的target部分中对其进行检查,以查找以oracledb_开头的任何指标。
监控什么
性能指标
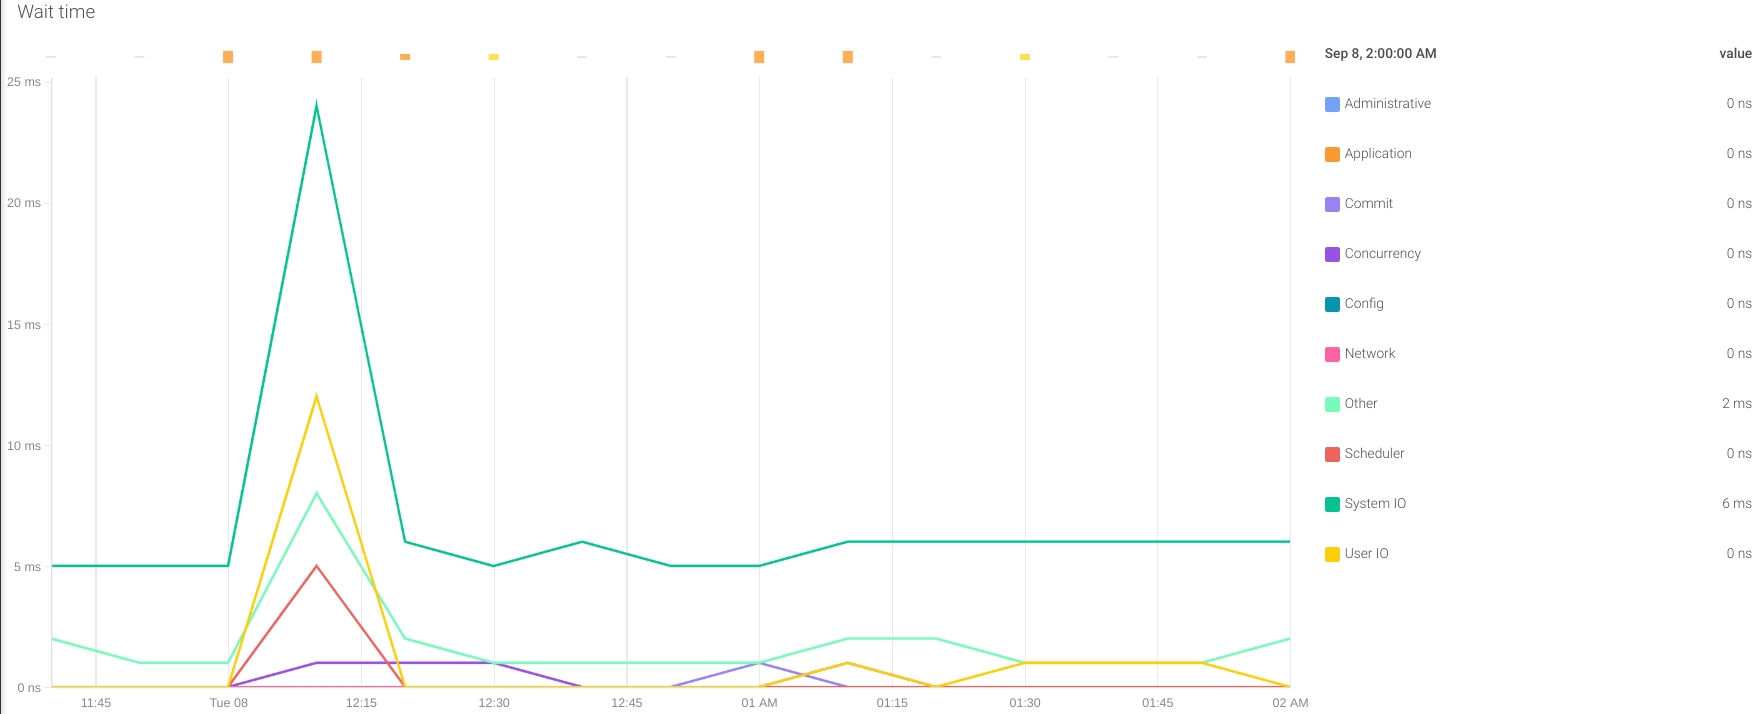
等待时间: exporter在Oracle数据库的不同活动中提供一系列等待时间的指标。它们都以oracledb_wait_time_前缀开头,它们有助于评估数据库在哪里花费了更多时间。它可以存在于I/O,网络,提交,并发等中。通过这种方式,我们可以确定系统中可能影响Oracle数据库整体性能的瓶颈。
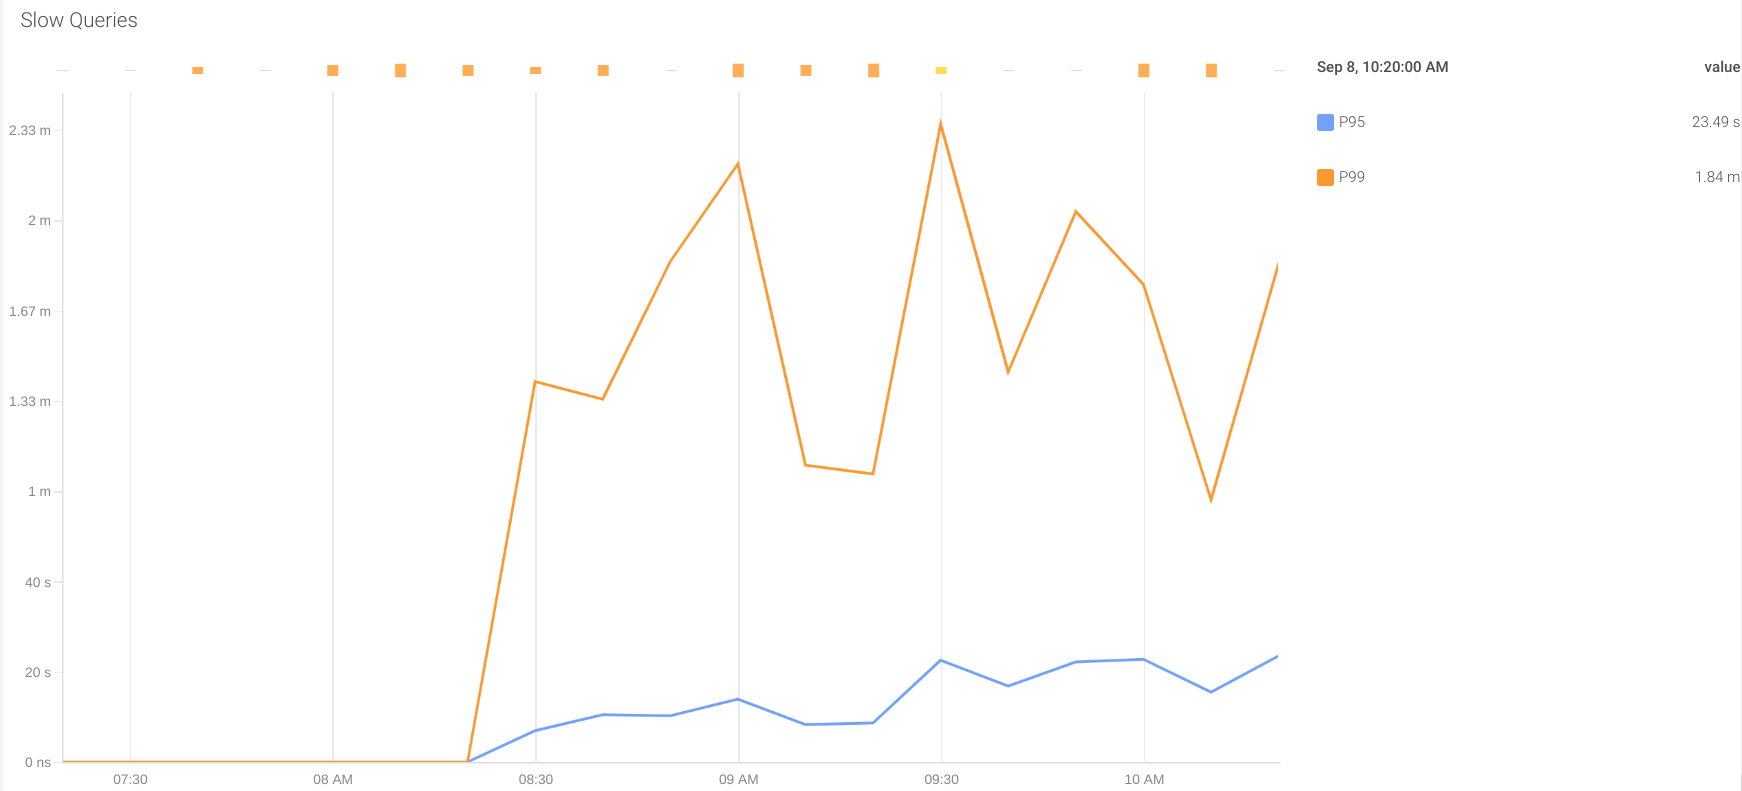
慢查询:某些查询返回结果所花的时间可能比其他查询长。如果此时间高于应用程序中配置的接收响应的超时时间,它将认为这是来自数据库的超时错误,然后重试查询。这种行为可能会使系统超负荷工作,并影响整体性能。
在上面显示的配置中,有两个自定义指标可提供最近5分钟内执行查询的响应时间的百分比95和99的信息。这些指标是:
- oracledb_slow_queries_p95_time_usecs
- oracledb_slow_queries_p99_time_usecs
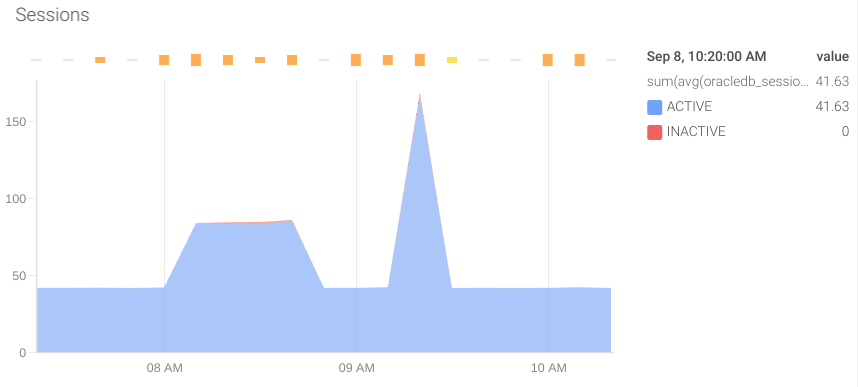
活动会话:监视Oracle数据库中活动会话很重要。如果超过配置的限制,则数据库将拒绝新连接,从而导致应用程序错误。提供此信息的指标是oracledb_sessions_value,标签status可以提供更多信息。
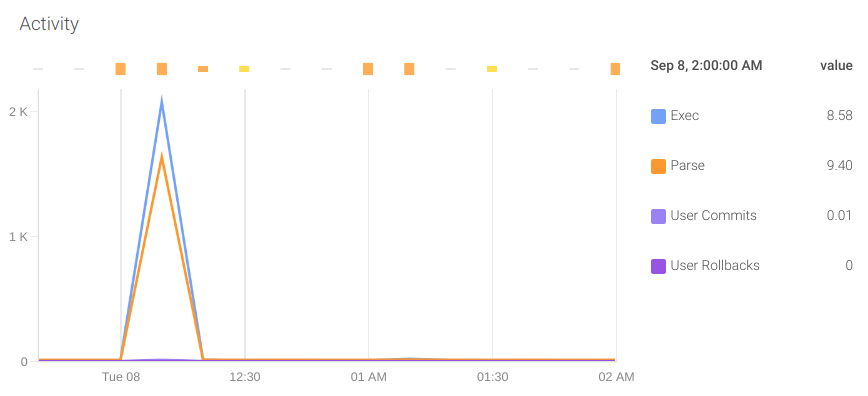
活动:监视数据库执行的操作也很重要。为此,我们可以依靠以下指标:
- oracledb_activity_execute_count
- oracledb_activity_parse_count_total
- oracledb_activity_user_commits
- oracledb_activity_user_rollbacks