Loki 是一个水平可扩展,高可用性,多租户日志聚合系统,灵感来自 Prometheus ,其设计非常经济高效,易于操作。它不索引日志的内容,而是为每个日志流设置一组标签。
与其他日志聚合系统相比,Loki:
- 不对日志进行全文本索引。通过存储压缩的,非结构化的日志以及仅索引元数据,Loki更加易于操作且运行成本更低。
- 使用与Prometheus相同的标签对日志流进行索引和分组,从而使您能够使用与Prometheus相同的标签在指标和日志之间无缝切换。
- 特别适合存储Kubernetes Pod日志。诸如Pod标签之类的元数据会自动被抓取并建立索引。
- 在Grafana中原生支持(需要Grafana v6.0及以上)。
基于Loki的日志记录堆栈包含3个组件:
- promtail是代理,负责收集日志并将其发送给Loki。
- loki是主服务器,负责存储日志和处理查询。
- Grafana用于查询和显示日志。
开始
大部分文章都是基于 k8s 、docker-compose去安装的,这里我们用二进制安装
Loki
类似 elasticsearch
安装
curl -O -L "https://github.com/grafana/loki/releases/download/v1.5.0/loki-linux-amd64.zip"
unzip loki-linux-amd64.zip
chmod a+x loki-linux-amd64
./loki-linux-amd64
配置文件 config.yaml
auth_enabled: false

server:
  http_listen_port: 3100

ingester:
  lifecycler:
    address: 127.0.0.1
    ring:
      kvstore:
        store: inmemory
      replication_factor: 1
    final_sleep: 0s
  chunk_idle_period: 5m
  chunk_retain_period: 30s

schema_config:
  configs:
    - from: 2018-04-15
      store: boltdb
      object_store: filesystem
      schema: v9
      index:
        prefix: index_
        period: 168h

storage_config:
  boltdb:
    directory: /tmp/loki/index

  filesystem:
    directory: /tmp/loki/chunks

limits_config:
  enforce_metric_name: false
  reject_old_samples: true
  reject_old_samples_max_age: 168h

chunk_store_config:
  max_look_back_period: 0

table_manager:
  chunk_tables_provisioning:
    inactive_read_throughput: 0
    inactive_write_throughput: 0
    provisioned_read_throughput: 0
    provisioned_write_throughput: 0
  index_tables_provisioning:
    inactive_read_throughput: 0
    inactive_write_throughput: 0
    provisioned_read_throughput: 0
    provisioned_write_throughput: 0
  retention_deletes_enabled: false
  retention_period: 0
Promtail
比如你要收集Nginx的错误日志,那就要在Nginx那台服务器部署 Promtail,类似 fluentd
安装
curl -O -l "https://github.com/grafana/loki/releases/download/v1.5.0/promtail-linux-amd64.zip"
unzip promtail-linux-amd64.zip
chmod a+x promtail-linux-amd64
./promtail-linux-amd64
配置文件 config.yaml
# Promtail Server Config
server:
  http_listen_port: 9080
  grpc_listen_port: 0

# Positions
positions:
  filename: /tmp/positions.yaml

# Loki服务器的地址
clients:
  - url: http://172.18.11.161:3100/loki/api/v1/push

scrape_configs:
  - job_name: nginx
    static_configs:
      - targets:
          - localhost
        labels:
          job: nginx-error
          host: localhost
          __path__: /usr/local/nginx/logs/error.log
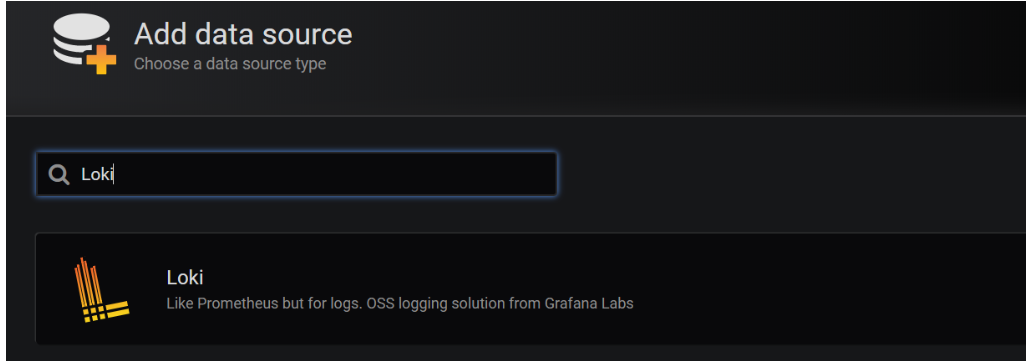
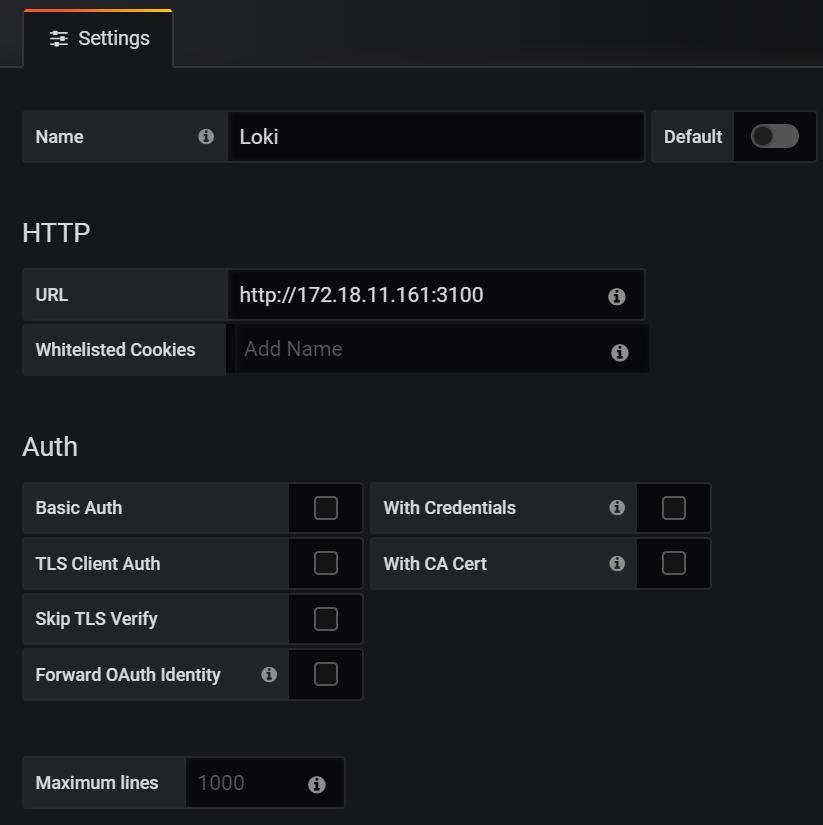
Grafana
打开Grafana,添加数据源,选
使用
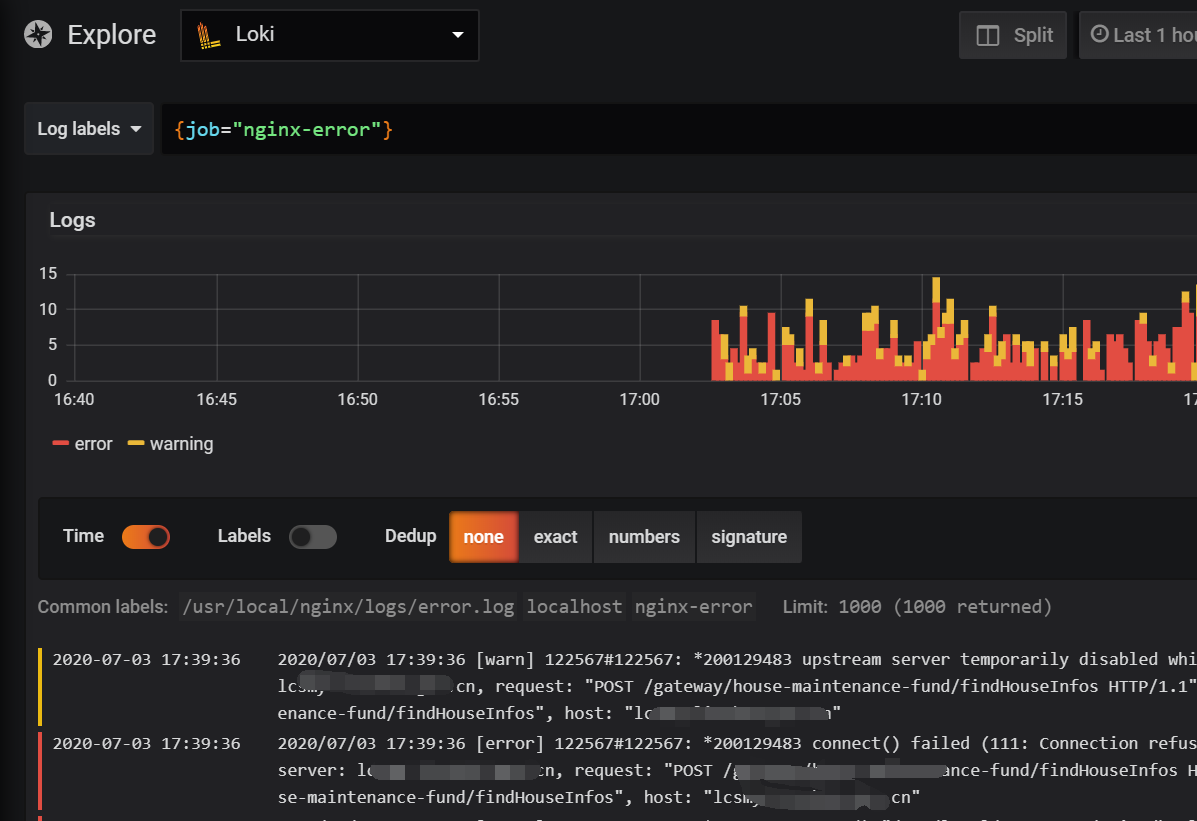
打开 Grafana,点击 Explore ,
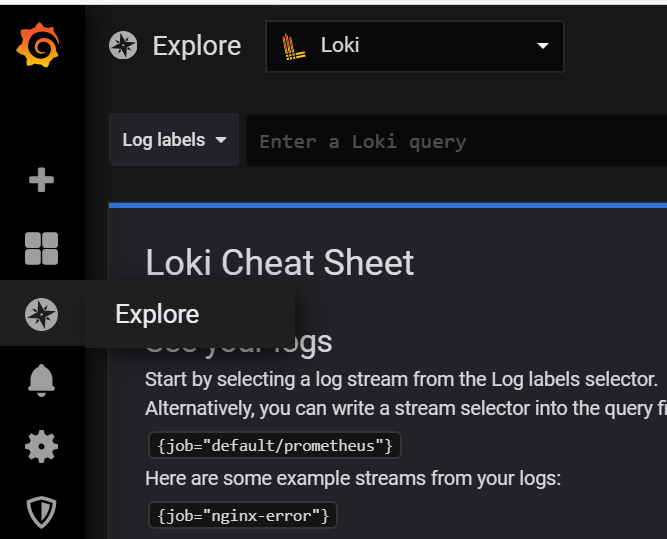
Log labels 输入 {job="nginx-error"}