贝赛尔曲线的定义
贝塞尔曲线(Bézier curve)是由法国雷诺公司的设计师Pierre Bézier设计。它的具体定义如下:

其中Pi(i=0,1,2,...n)称作曲线的控制向量,他们组成的连续多段线叫做曲线的控制多边形; t ∈[0,1],即 t 从0连续变化到1时所生成的曲线就叫做贝赛尔曲线。而函数:

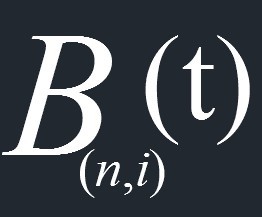
叫做贝塞尔基函数(Bézier basis functions),也叫做伯恩斯坦多项式(Bernstein polynomials)它的定义如下:

其中n!=1*2*3*...*n 即n的阶乘函数。
参考:http://www.cs.mtu.edu/~shene/COURSES/cs3621/NOTES/spline/Bezier/bezier-construct.html
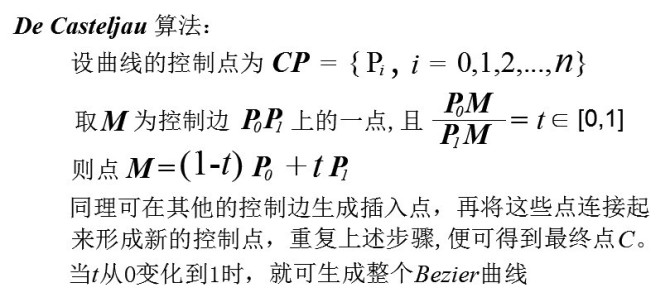
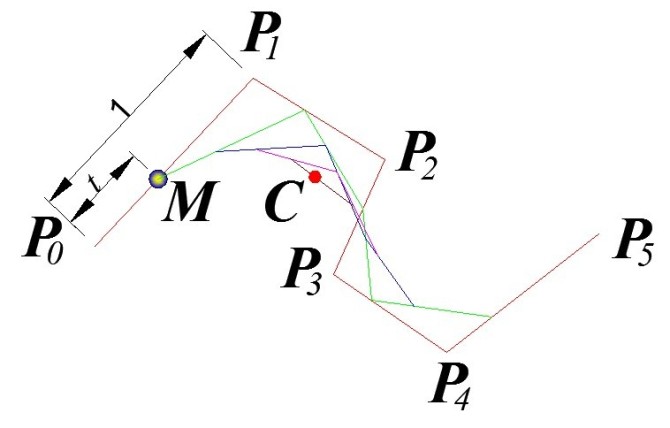
在 http://www.cs.mtu.edu/~shene/COURSES/cs3621/NOTES/spline/Bezier/de-casteljau.html 介绍了一个生成Bezier曲线上点的算法:
 
实现的代码
以下是在AutoCAD 2011 x64 中实现的代码,其他版本大同小异(vba实现):
Sub bezier()
Dim i As Long, j As Long, m As Long, n As Long
Dim Coor As Variant, BezierPs() As Double, p(2) As Double
Dim t As Double, s As Double, DeltaT As Double
Dim SelecPoly As AcadSelectionSet
Dim pointObj As AcadPoint, BezierL As AcadPolyline
Dim pointID(10000000) As Double
'delete all selection sets
i = 0
Do While ThisDrawing.SelectionSets.Count > 0
ThisDrawing.SelectionSets.Item(i).Delete
i = i + 1
Loop
'select a polyline in your drawing
Set SelecPoly = ThisDrawing.SelectionSets.Add("ControlPoly")
SelecPoly.SelectOnScreen
'draw vertices of the Bezier Curve
DeltaT = 0.001
i = j = m = 0
n = UBound(SelecPoly.Item(0).Coordinates) - 1
Do While t <= 1 + DeltaT
s = 1 - t
Coor = SelecPoly.Item(0).Coordinates
For i = 1 To n / 2
For j = 0 To n - 2 * i Step 2
Coor(j) = s * Coor(j) + t * Coor(j + 2)
Coor(j + 1) = s * Coor(j + 1) + t * Coor(j + 3)
Next
Next
p(0) = Coor(0): p(1) = Coor(1): p(2) = 0
Set pointObj = ThisDrawing.ModelSpace.AddPoint(p)
pointObj.Visible = True
pointID(m) = pointObj.ObjectID32 'store the objectIDs of points
m = m + 1
t = t + DeltaT
Loop
'draw polyline to approximate Bezier Curve
ReDim BezierPs(3 * m - 1)
j = 0
For i = 0 To 3 * m - 3 Step 3
Set pointObj = ThisDrawing.ObjectIdToObject32(pointID(j))
BezierPs(i) = pointObj.Coordinates(0)
BezierPs(i + 1) = pointObj.Coordinates(1)
BezierPs(i + 2) = pointObj.Coordinates(2)
j = j + 1
Next
Set BezierL = ThisDrawing.ModelSpace.AddPolyline(BezierPs)
'delete points
For i = 0 To m - 1
Set pointObj = ThisDrawing.ObjectIdToObject32(pointID(i))
pointObj.Delete
Next
End Sub
|
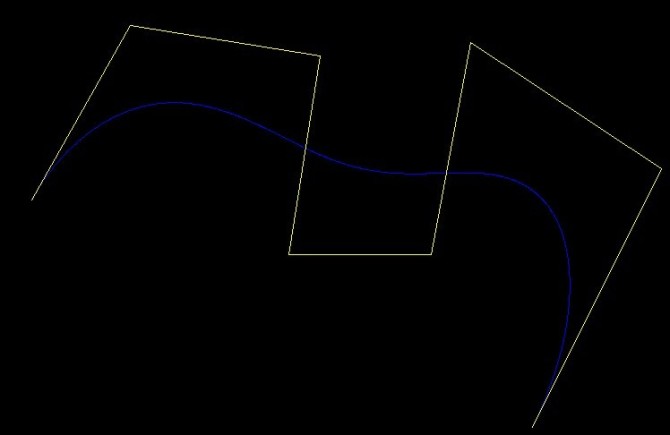
下面是生成的曲线效果图:
|


