本文转自:https://www.idalko.com/jira-dashboards-confluence/
This article was written by Maria Kurnosenko from Stiltsoft.
Jira is one of the intuitive project management tools used by companies of all sizes for tracking tasks and managing workflow. When combined with Confluence, it can become even more beneficial for teamwork. You can both set and share tasks as well as work on these two tools mutually. And there are many more advantages to using Jira dashboards in Confluence.
In this blog post, you’ll learn more about using Jira dashboards in Confluence and find some handy tricks to incorporate into your work.
Why we Need Jira Dashboards in Confluence
Using Jira and Confluence together allows you to get the best out of these two environments. You can set tasks, track them, and collaborate with your colleagues. These two tools in a bundle allow you to create a powerful and convenient workspace for your team.
Jira has several macros that allow it to output tables, charts, and graphs. Use the Jira Issues macro to get the table with a list of Jira issues or produce a chart with the help of the Jira Chart macro.
If you want to build a Jira dashboard in Confluence, you can also use other tools, like Table Filter and Charts for Confluence. You can apply it to the Jira Issues table after you output it to the Confluence page and perform various operations with this data. These are just a couple of things you can do:
- filter Jira issues by different parameters
- summarize or aggregate data in pivot tables
- create customizable charts and graphs
All of these can be useful in project management and work organization, especially if you need to make reports and presentations from time to time.
Now let’s see how we can monitor projects using Jira dashboards in Confluence. But before anything, we first need to connect the two environments.
How to Connect Jira and Confluence
If you use Confluence Cloud, you don’t need to additionally connect Jira and Confluence. To depict Jira issues, just copy a URL of a task or a project and paste it into the Confluence page. You can also use JQL to specify the parameters.
After you finish editing, save the page and you’ll see the details. To output multiple issues, you can also use the Jira Issues macro. In that case, you’ll need to select the issues you want to show and choose display options. See more details about using the Jira Issues macro below.
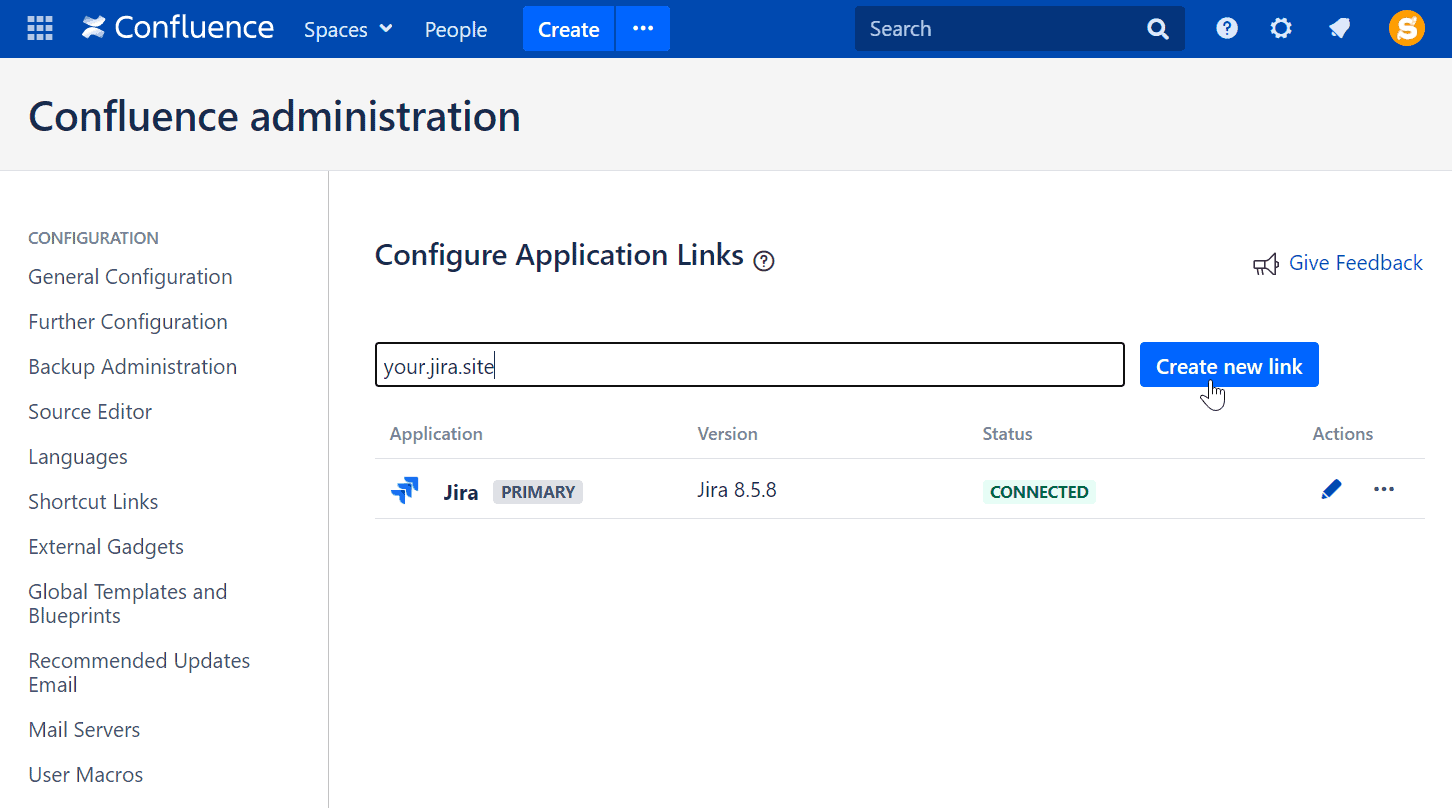
Server and Data Center Confluence versions need to be linked to Jira before you output issues on your Confluence page. You can do this with the help of Application Links. Note that only admins of both spaces can establish the two-way app link.
How to Display Jira issues in Confluence
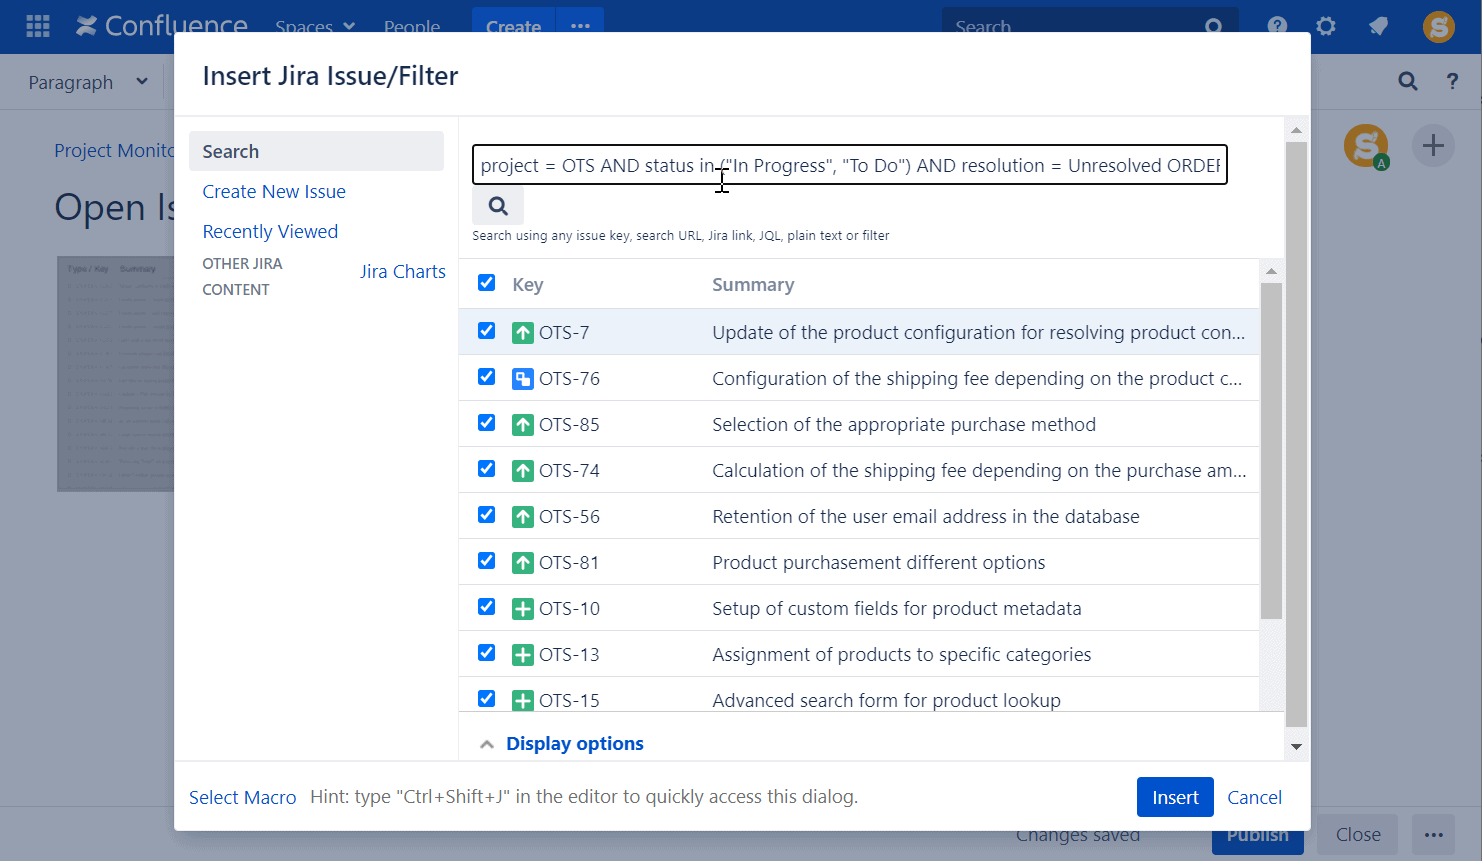
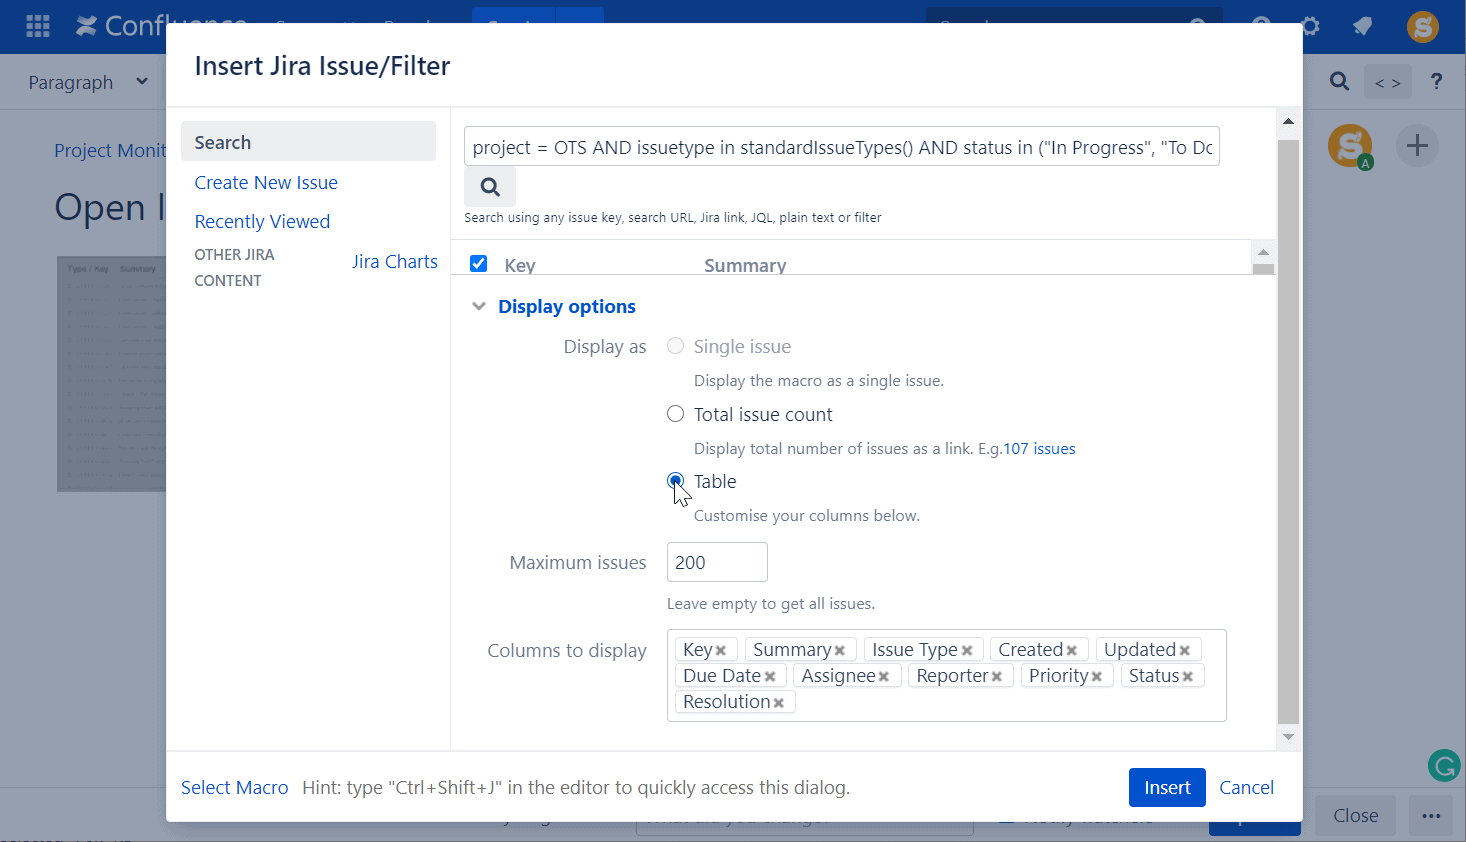
Generally, when you need to output a table containing multiple Jira issues, you use the Jira Issues macro. After you add the macro, choose which tasks to display. There are several ways to do that:
- Open your project in Jira and filter it. For example, choose a type of issue, status, or assignee. After you apply the filters, copy the URL and paste it into your Confluence page. It will automatically transform into the Jira Issues macro.
- Add the Jira Issues macro first. Paste a URL there. Alternatively, type a JQL query manually to specify which project and type of issues you need.
After you save the page, you’ll see a table containing all details of your Jira issues. There are a few ways to display these issues.
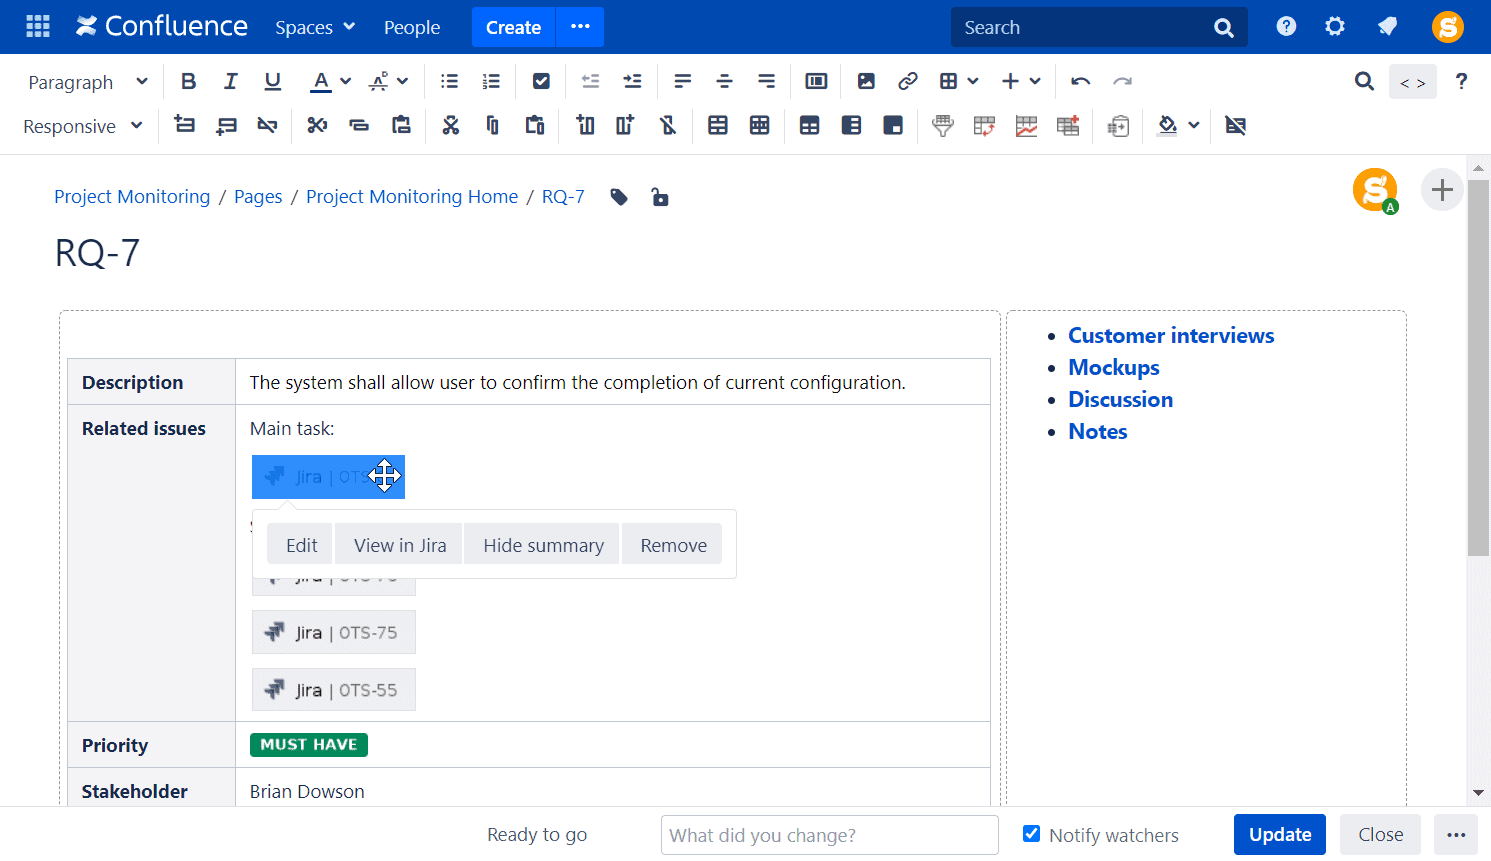
A single issue: Sometimes you just need to include one issue in your report or while describing detailed requirements. In this case, you won’t generate a list of tasks and rather add one of them in the corresponding place in your content.

Total issue count: This will come in handy when you are making a report on a project and want to have a general overview of its tasks.
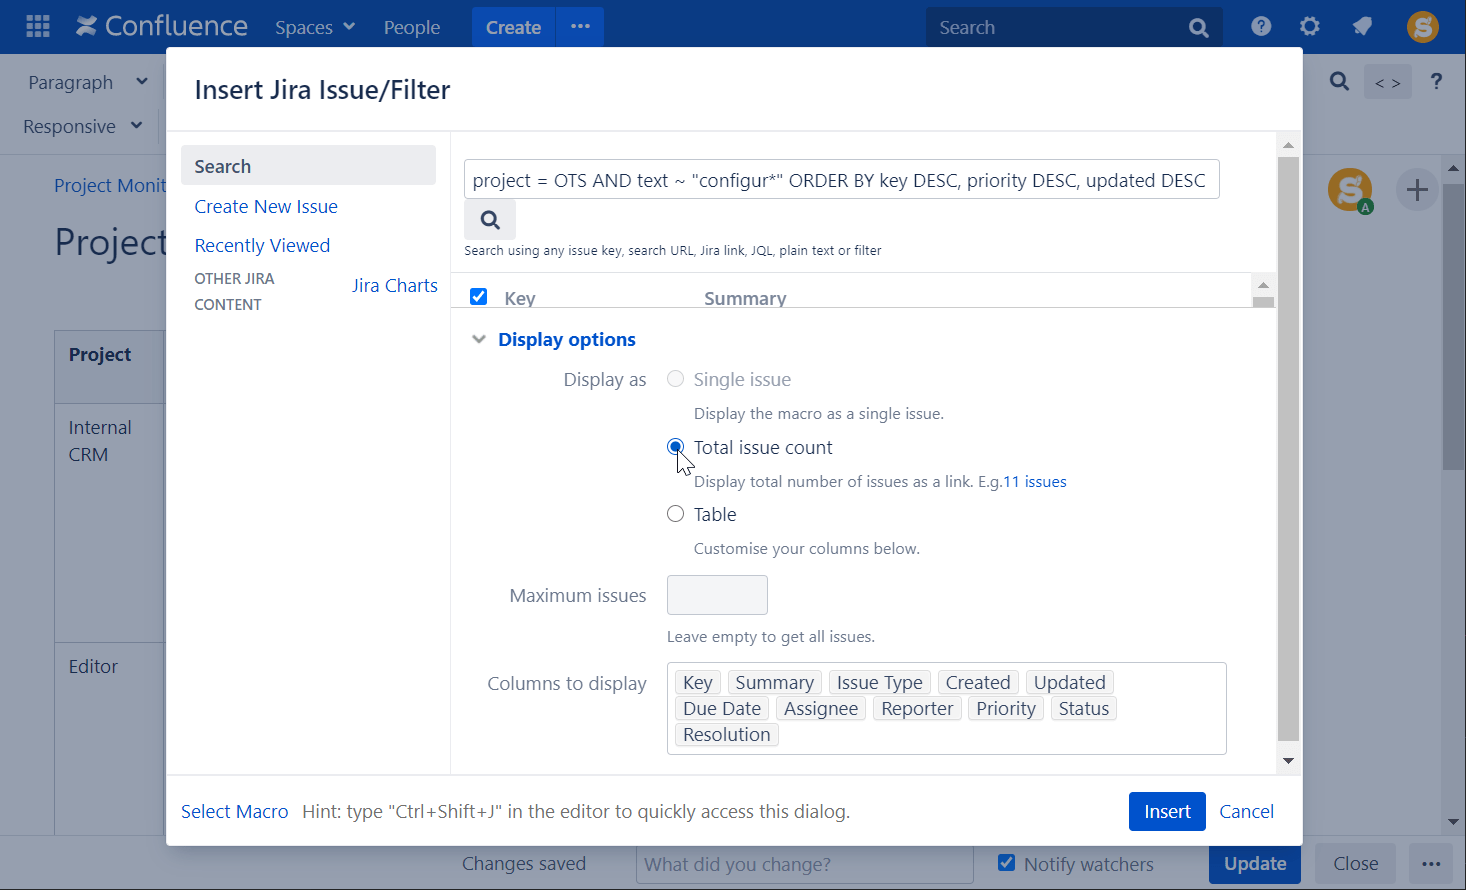
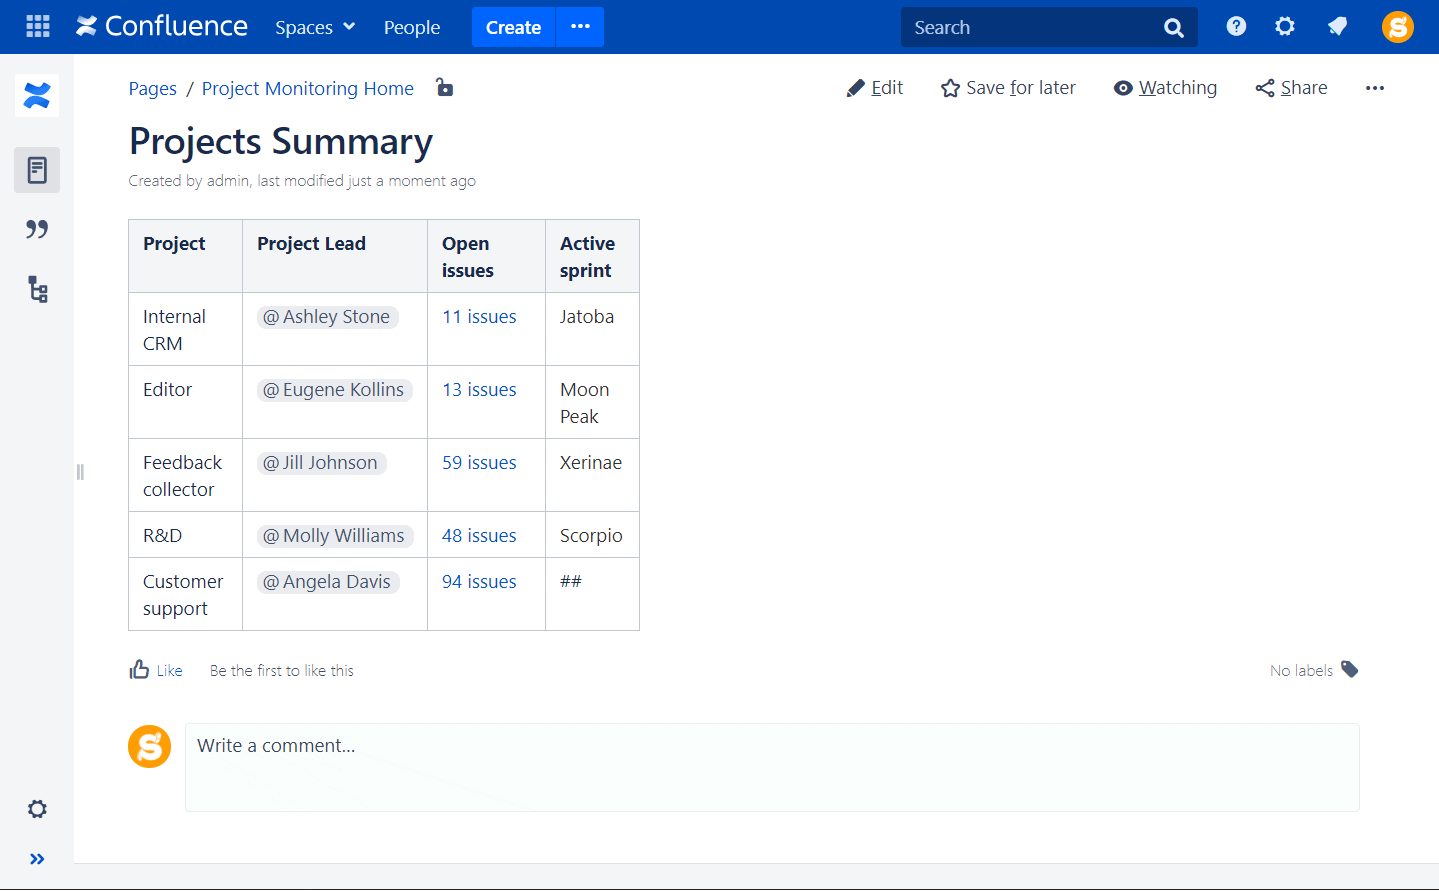
A detailed table of issues: You can set various display options, like the columns to depict and the number of issues in the table. Keep in mind that the maximum number of issues in one macro is 1,000. If your project has more issues, there is a way to output them all too.
Apply more precise filters and output smaller tables with up to 1,000 issues in each of them. Next, use Table Filter and Charts for the Confluence app. Apply the Table Transformer macro to your tables and merge them. Remember that it can make your page heavier, and it may take much longer to load.

How to Create your First Jira Chart
Confluence offers to visualize Jira data with the help of the Jira Charts macro. The options are limited though since you can only turn Jira issues into a chart in three ways:
- Pie Chart shows the distribution of issues based on various parameters: type, project, assignee, priority, and many more.
- Created vs Resolved Сhart depicts the ratio of created and resolved tasks in a certain period of time.
- Two Dimensional Сhart resembles a pivot table, aggregating issues against different parameters.

One chart does not always meet all of your needs. You can fix this by adding several Jira charts to one Confluence page. If you still want to see more on your Jira dashboard, look into creating a custom one.
How to Build Custom Jira Dashboards in Confluence
If you need a more flexible approach to building Jira dashboards in Confluence, you can try using various Jira apps available in the Marketplace, for example,Table Filter and Charts for Confluence. As said before, it allows you to apply various filters, create pivot tables, charts, and graphs. Let’s see a few things you can do with the help of this app.
One of the most popular charts you can build from Jira issues is Gantt. If your team works in sprints, the Gantt chart will help you see the process of interacting with tasks through sprint time. Table Filter and Charts for Confluence allow you to build various Gantt charts based on tables with Jira issues. The chart can be very simplistic or very detailed, showing the distribution and completion of tasks throughout all of the sprints and phases of the project.
Building a Gantt chart requires the start and finish dates for each task. If you want to learn more about this type of chart, check out 5 tips that will help you become a Gantt chart pro.
Note: Learn more about Jira Gantt Charts.

Another chart you can build will help you compare estimated vs. actual spent time. After you output these statistics with Jira Issues, apply Table Filter and Charts to this table. If you choose a bar chart, you’ll make a visual representation of estimated and real length.

The same kind of chart will be helpful while calculating velocity. It shows the velocity of each sprint and allows comparing all of them together in a visually engaging way.
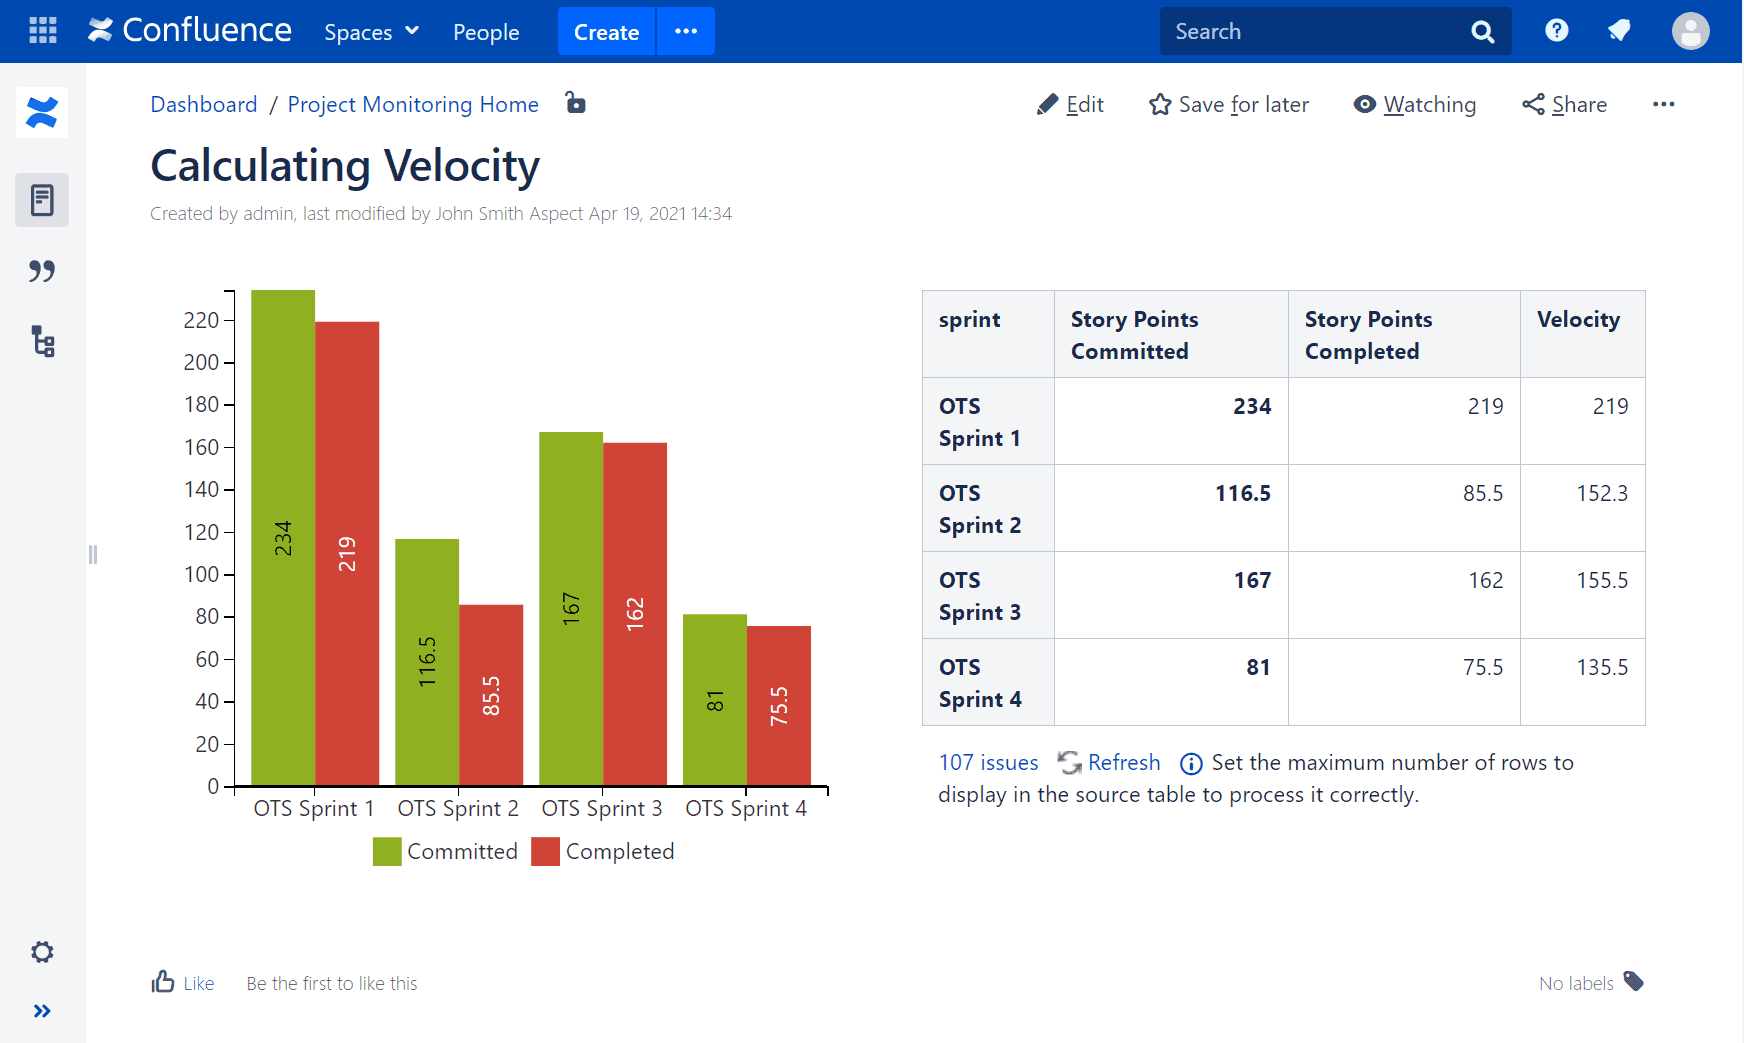
These are just a few examples of charts you can build with Table Filter and Charts for Confluence.
If you want to get more ideas for Jira issues visualization, figure out how to build Handy Jira Dashboards for Project Management in Confluence.
Conclusion
In this article, we walked you through 4 simple steps to monitoring projects using Jira dashboards in Confluence. There is no right or wrong answer when it comes to organizing Jira dashboards. Try out various tools and methods, and you’ll find what works best for your project.
Hopefully, this post gave you some inspiration to combine multiple tools and get creative with your charts.
Recommended Reads: