诊断病人用药
我搬来了一组数据,病人的生理信息和医生开的药品,决策树的内容就是根据生理信息推断病人应该用什么药。数据有点少,只有20个,最后结果差异可能有点大。
#    年龄         性别        血压          胆固醇                 钠浓度       钾浓度        吃啥药
data = [
    {'age': 33, 'sex': 'F', 'BP': 'high', 'cholesterol': 'high', 'Na': 0.66, 'K': 0.06, 'drug': 'A'},
    {'age': 77, 'sex': 'F', 'BP': 'high', 'cholesterol': 'normal', 'Na': 0.19, 'K': 0.03, 'drug': 'D'},
    {'age': 88, 'sex': 'M', 'BP': 'normal', 'cholesterol': 'normal', 'Na': 0.80, 'K': 0.05, 'drug': 'B'},
    {'age': 39, 'sex': 'F', 'BP': 'low', 'cholesterol': 'normal', 'Na': 0.19, 'K': 0.02, 'drug': 'C'},
    {'age': 43, 'sex': 'M', 'BP': 'normal', 'cholesterol': 'high', 'Na': 0.36, 'K': 0.03, 'drug': 'D'},
    {'age': 82, 'sex': 'F', 'BP': 'normal', 'cholesterol': 'normal', 'Na': 0.09, 'K': 0.09, 'drug': 'C'},
    {'age': 40, 'sex': 'M', 'BP': 'high', 'cholesterol': 'normal', 'Na': 0.89, 'K': 0.02, 'drug': 'A'},
    {'age': 88, 'sex': 'M', 'BP': 'normal', 'cholesterol': 'normal', 'Na': 0.80, 'K': 0.05, 'drug': 'B'},
    {'age': 29, 'sex': 'F', 'BP': 'high', 'cholesterol': 'normal', 'Na': 0.35, 'K': 0.04, 'drug': 'D'},
    {'age': 53, 'sex': 'F', 'BP': 'normal', 'cholesterol': 'normal', 'Na': 0.54, 'K': 0.06, 'drug': 'C'},
    {'age': 36, 'sex': 'F', 'BP': 'high', 'cholesterol': 'high', 'Na': 0.53, 'K': 0.05, 'drug': 'A'},
    {'age': 63, 'sex': 'M', 'BP': 'low', 'cholesterol': 'high', 'Na': 0.86, 'K': 0.09, 'drug': 'B'},
    {'age': 60, 'sex': 'M', 'BP': 'low', 'cholesterol': 'normal', 'Na': 0.66, 'K': 0.04, 'drug': 'C'},
    {'age': 55, 'sex': 'M', 'BP': 'high', 'cholesterol': 'high', 'Na': 0.82, 'K': 0.04, 'drug': 'B'},
    {'age': 35, 'sex': 'F', 'BP': 'normal', 'cholesterol': 'high', 'Na': 0.27, 'K': 0.03, 'drug': 'D'},
    {'age': 23, 'sex': 'F', 'BP': 'high', 'cholesterol': 'high', 'Na': 0.55, 'K': 0.08, 'drug': 'A'},
    {'age': 49, 'sex': 'F', 'BP': 'low', 'cholesterol': 'normal', 'Na': 0.27, 'K': 0.05, 'drug': 'C'},
    {'age': 27, 'sex': 'M', 'BP': 'normal', 'cholesterol': 'normal', 'Na': 0.77, 'K': 0.02, 'drug': 'B'},
    {'age': 51, 'sex': 'F', 'BP': 'low', 'cholesterol': 'high', 'Na': 0.20, 'K': 0.02, 'drug': 'D'},
    {'age': 38, 'sex': 'M', 'BP': 'high', 'cholesterol': 'normal', 'Na': 0.78, 'K': 0.05, 'drug': 'A'}
]
简单分析一下data数据:
drug = [d['drug'] for d in data]
# 字典里去掉drug条目
# [d.pop('drug') for d in data]

# 提取各项数值型数据
age = [d['age'] for d in data]
Na = [d['Na'] for d in data]
K = [d['K'] for d in data]
# 服用药品数字化
drugN = [ord(d)-ord('A') for d in drug]

# 散点图可视化数据
import matplotlib.pyplot as plt
# style.use要在其他plt操作前设置
plt.style.use('ggplot')
plt.subplot(221)
plt.scatter(age, Na, c=drugN, s=50)
plt.xlabel('age')
plt.ylabel('Na')

plt.subplot(222)
plt.scatter(age, K, c=drugN, s=50)
plt.xlabel('age')
plt.ylabel('K')

plt.subplot(223)
plt.scatter(Na, K, c=drugN, s=50)
plt.xlabel('Na')
plt.ylabel('K')

plt.show()
可视化结果:

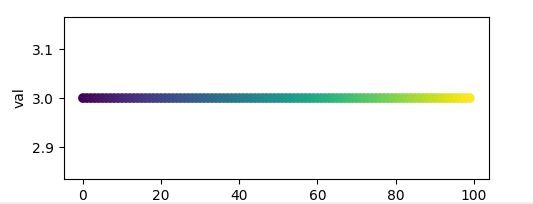
点的颜色参考下面这个色卡,。dataN:[0, 3, 1, 2, 3, 2, 0, 1, 3, 2, 0, 1, 2, 1, 3, 0, 2, 1, 3, 0],其中0,1,2,3,在图中分别代表不同颜色的点,0对应最左的颜色,3对应最右,1、2分别代表1/4和3/4处颜色。
import matplotlib.pyplot as plt
import numpy as np
color = x = np.arange(0, 100)
val = [3]*100
plt.scatter(x, val, c=color)
plt.xlabel('x')
plt.ylabel('val')
plt.show()
结果来看,病人用药可能和Na、K浓度有关。
利用sklearn分离数据集和数据集,创建并训练决策树,最后计算训练数据和测试数据的准确率,将结果决策树导出为graphviz格式
import numpy as np
from sklearn.feature_extraction import DictVectorizer

drug = [d['drug'] for d in data]
drugN = [ord(d)-ord('A') for d in drug]
# 要吃啥药是预测目标,把它从data中删掉
[d.pop('drug') for d in data]

vec = DictVectorizer(sparse=False)
data_pre = vec.fit_transform(data)
# 转换浮点,兼容opencv
# data_pre = np.array(data_pre, np.float32)

# 数据分隔成 训练集 和 数据集,分别是15个、5个
import sklearn.model_selection as ms
xtrain, xtest, ytrain, ytest = ms.train_test_split(data_pre, drugN, test_size=5, random_state=10)

from sklearn import tree
# 构建建决策树
dtc = tree.DecisionTreeClassifier()
# 训练数据
dtc.fit(xtrain, ytrain)
print(dtc.score(xtrain, ytrain))
print(dtc.score(xtest, ytest))
with open("tree.dot", 'w') as f:
    f = tree.export_graphviz(dtc, out_file=f)
多次运行的结果会有些差异

生成的决策树,可以指定一些名称,写在第二个例子里了:
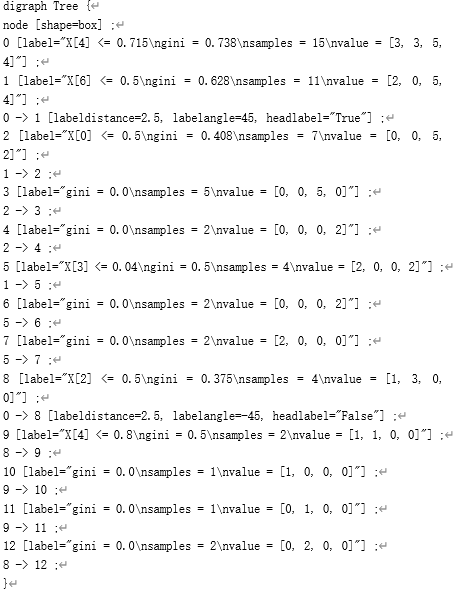
使用Graphviz的dot程序,在命令行将.dot文件转换成图片.png,也就得到了决策树。X[n]对应vec.get_feature_names()名字;gini基尼系数,gini为0也就得到纯叶节点;samples样例个数;values样例对应的目标和次数。
dot -Tpng "G:projectmachine learning	ree.dot" -o "G:projectmachine learning	ree.png"
// X[n]内容:['BP=high', 'BP=low', 'BP=normal', 'K', 'Na', 'age', 'cholesterol=high', 'cholesterol=normal', 'sex=F', 'sex=M']

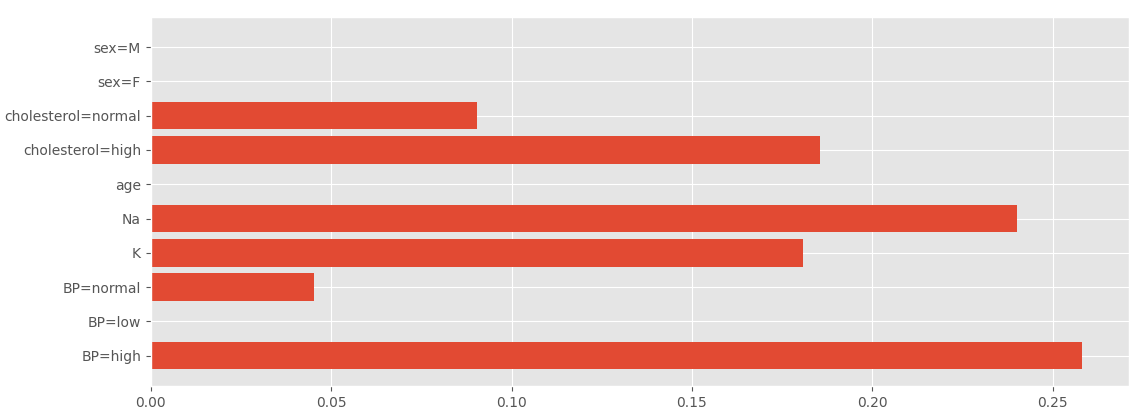
查看各个特征重要性的值:
import matplotlib.pyplot as plt
plt.style.use('ggplot')
plt.barh(range(10), dtc.feature_importances_, align='center', tick_label=vec.get_feature_names())
plt.show()
决策树总结 — scitik-learn乳腺癌诊断样本
使用sklearn的样本数据集构建乳腺癌诊断决策树,对上面的内容今昔那个了总结。
from sklearn import datasets
import numpy as np
data = datasets.load_breast_cancer()
print(dir(data))
print(data.data.shape)
print(data.target_names)

import sklearn.model_selection as ms
xtrain, xtest, ytrain, ytest = ms.train_test_split(data.data, data.target, test_size=0.2, random_state=42)

from sklearn import tree
dtc = tree.DecisionTreeClassifier()
dtc.fit(xtrain, ytrain)
print(dtc.score(xtrain, ytrain))
print(dtc.score(xtest, ytest))

with open('canceltree.dot', 'w') as f:
    f = tree.export_graphviz(dtc, out_file=f,feature_names=data.feature_names, class_names=data.target_names)
out:
['DESCR', 'data', 'feature_names', 'filename', 'frame', 'target', 'target_names']
(569, 30)
['malignant' 'benign']
1.0
0.9473684210526315
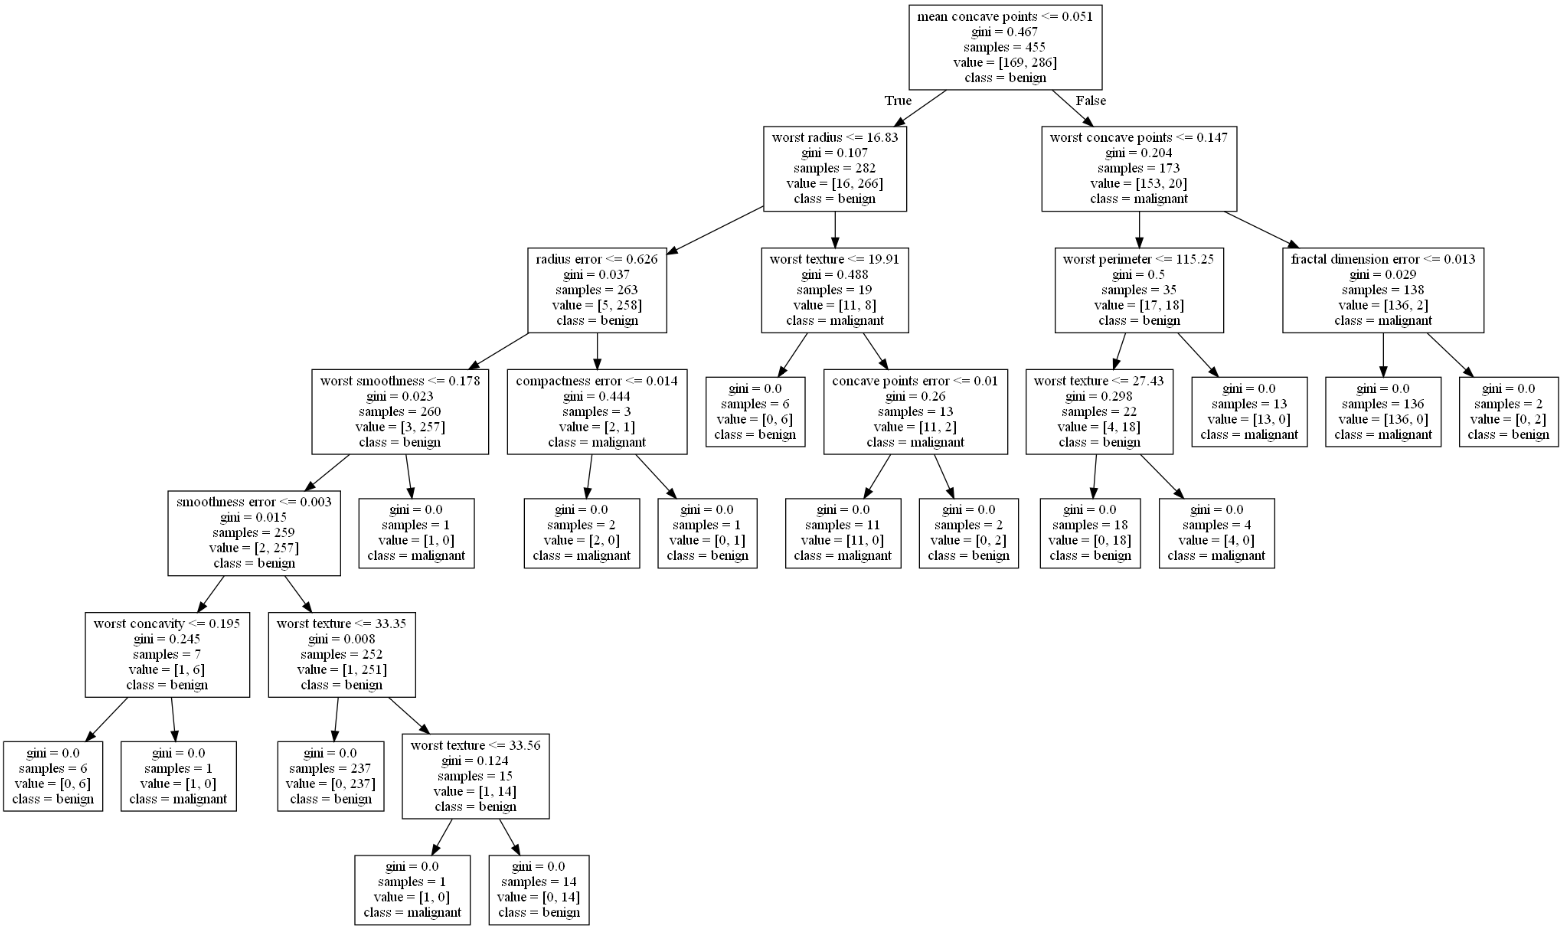
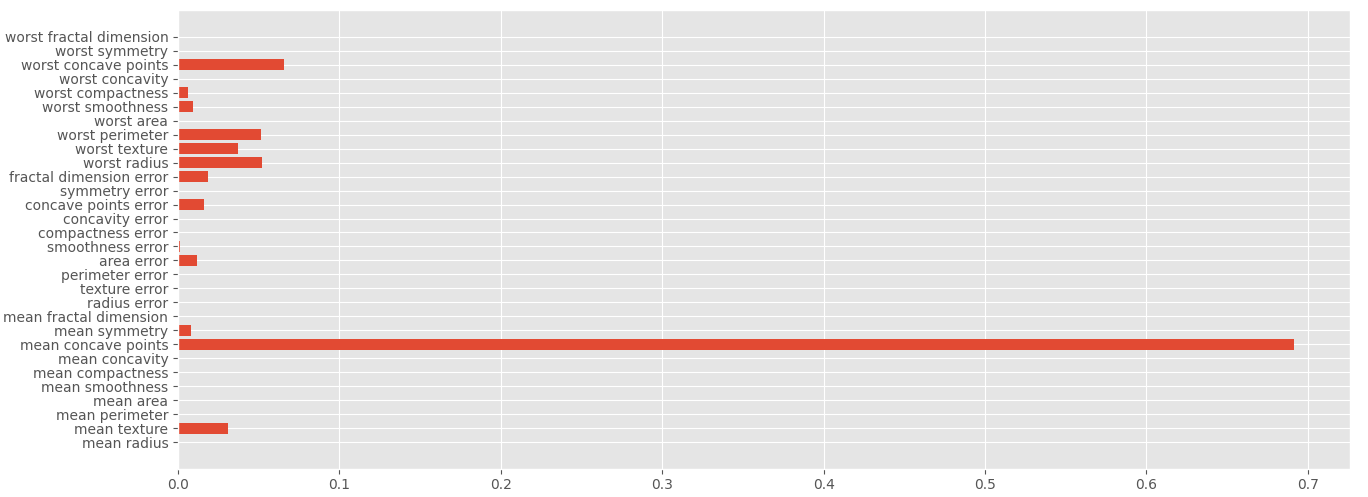
各特征重要性评分展示
import matplotlib.pyplot as plt
plt.style.use('ggplot')
plt.barh(range(len(data.feature_names)), dtc.feature_importances_, align='center', tick_label=data.feature_names)
plt.show()
