1 彩色增强
rgb=imread('sea_desert.bmp');
subplot(221),imshow(rgb)
title('原始真彩色图像')
subplot(222),imshow(rgb(:,:,1))
title('真彩色红分量')
subplot(223),imshow(rgb(:,:,2))
title('真彩色绿色分量')
subplot(224),imshow(rgb(:,:,3))
title('真彩色蓝色分量')
这显然是不对的,问题出在哪里呢?
>> info=imfinfo('sea_desert.bmp');
>> info
info =
Filename: 'sea_desert.bmp'
FileModDate: '16-May-2009 16:59:30'
FileSize: 2098230
Format: 'bmp'
FormatVersion: [1x33 char]
Width: 1024
Height: 683
BitDepth: 24
ColorType: 'truecolor'
FormatSignature: 'BM'
NumColormapEntries: 0
Colormap: []
RedMask: []
GreenMask: []
BlueMask: []
ImageDataOffset: 54
BitmapHeaderSize: 40
NumPlanes: 1
CompressionType: 'none'
BitmapSize: 2098176
HorzResolution: 0
VertResolution: 0
NumColorsUsed: 0
NumImportantColors: 0
另一个实验
rgb=imread('sea_desert.bmp');
image_type=isrgb(rgb);
Warning: isrgb is obsolete and may be removed in the future.
See product release notes for more information.
In isrgb at 29
image_type
image_type =
1
camp=rgb2hsv(rgb);
subplot(121)
imshow(rgb)
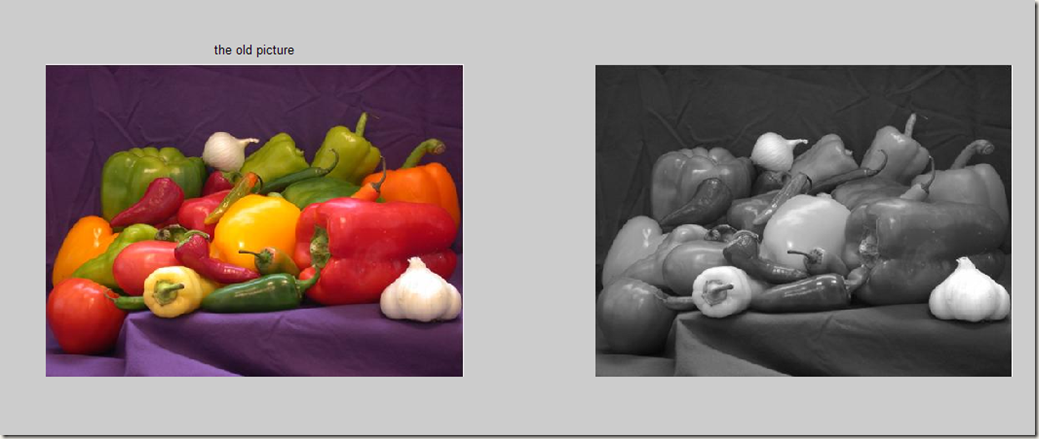
title('the old picture')
subplot(122)
imshow(camp)
实验结果如下:
试探性使用彩色分离:
figure,imshow(camp(:,:,2))
结果如下
这个不是我想得到的
于是,上网收索,发现这一图片:这一收索得到的 imshow(rgb(:,:,3))
>> size(rgb)
ans =
683 1024 3
于是,在得到图片后,进行相同操作:
>> rgb=imread('vegetable.jpg');
>> info=imfinfo('vegetable.jpg')
info =
Filename: 'vegetable.jpg'
FileModDate: '24-May-2009 01:23:46'
FileSize: 24951
Format: 'jpg'
FormatVersion: ''
Width: 512
Height: 384
BitDepth: 24
ColorType: 'truecolor'
FormatSignature: ''
NumberOfSamples: 3
CodingMethod: 'Huffman'
CodingProcess: 'Sequential'
Comment: {}
>> subplot(221),imshow(rgb(:,:,3))
>> subplot(222),imshow(rgb(:,:,2))
>> subplot(223),imshow(rgb(:,:,1))
>> subplot(224),imshow(rgb)
难道,这就是真的是我要的效果????
http://www.mathworks.com/matlabcentral/fx_files/13684/1/content/html/flyexdemo.html
这个网站里头的东西,证实确实如此:,也就是这个跟比特,和图像模型并没有怎么大的不同
rgb=imread('vegetable.jpg');
ntsc=rgb2ntsc(rgb);
subplot(121)
imshow(rgb)
title('the old picture')
subplot(122)
imshow(ntsc(:,:,1))
如果是显示全部图像,则是如下:
>> imshow(ntsc)
rgb和 ycbcr模式:
>> rgb=imread('vegetable.jpg');
>> ycbcr=rgb2ycbcr(rgb);
>> subplot(121)
>> imshow(rgb)
>> title('原来图像')
>> subplot(122)
>> imshow(ycbcr)
>>
>> I=imread('vegetable.jpg');
>> E1=mat2gray(I(:,:,1));
>> E2=mat2gray(I(:,:,2));
>> E3=mat2gray(I(:,:,3));
>> Q(:,:,1)=E1;
>> Q(:,:,2)=E2;
>> Q(:,:,3)=E3;
>> x1=isrgb(Q)
Warning: isrgb is obsolete and may be removed in the future.
See product release notes for more information.
> In isrgb at 29
x1 =
1
>> x2=isgray(I(:,:,3))
Warning: isgray is obsolete and may be removed in the future.
See product release notes for more information.
> In isgray at 27
x2 =
1
>> x3=isgray(E3)
Warning: isgray is obsolete and may be removed in the future.
See product release notes for more information.
> In isgray at 27
x3 =
1
>>
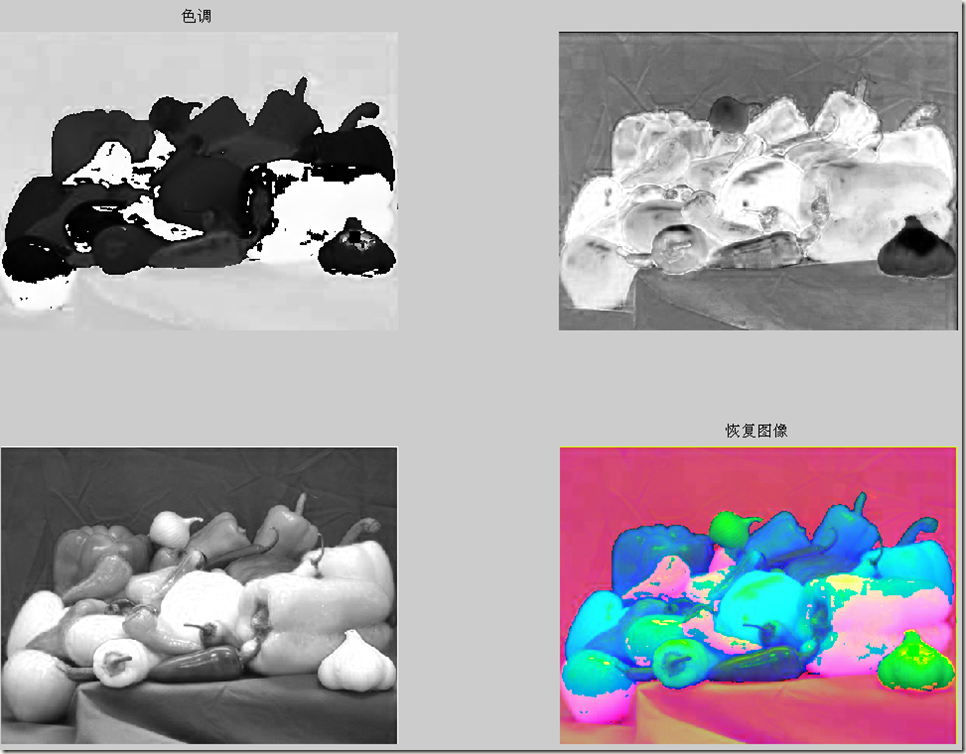
>> I=imread('vegetable.jpg');
>> HSV=rgb2hsv(I);
>> H=HSV(:,:,1);
>> S=HSV(:,:,2);
>> V=HSV(:,:,3);
>> subplot(221)
>> imshow(H)
>> title('色调')
>> subplot(222)
>> imshow(S)
>> subplot(223)
>> imshow(V)
>> q(:,:,1)=H;
>> q(:,:,2)=V;
>> q(:,:,3)=S;
>> subplot(224)
>> imshow(q)
>> title('恢复图像')
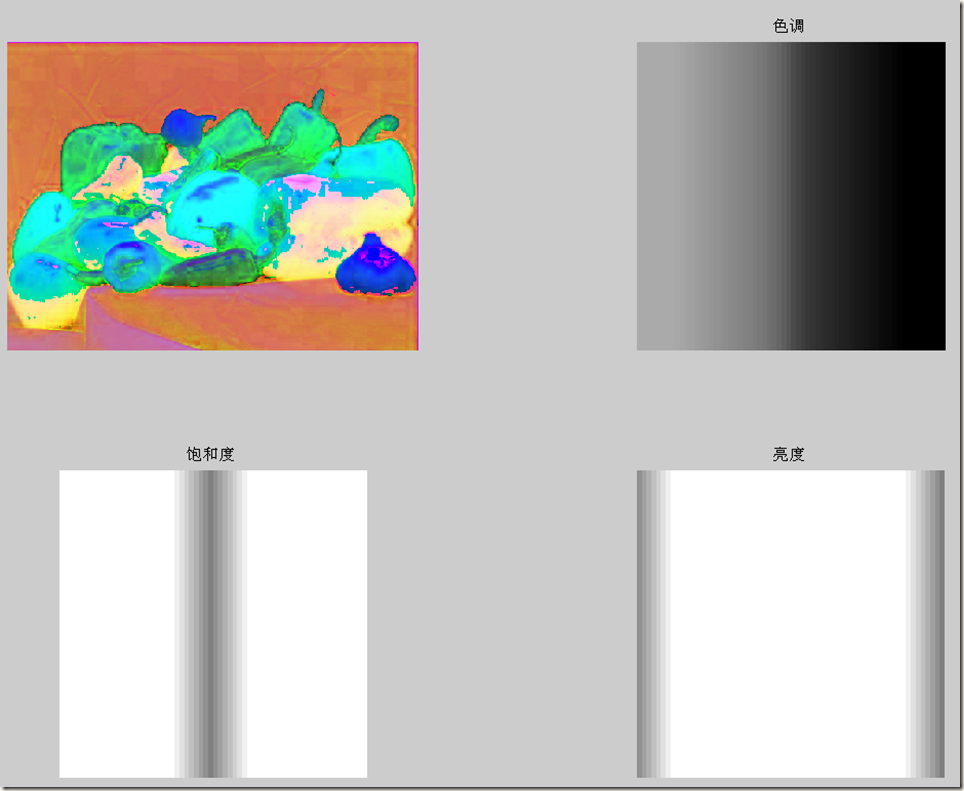
>> figure,imshow(HSV);
>> figure;subplot(221);imshow(HSV);
>> RGB=reshape(ones(64,1)*reshape(jet(64),1,192),[64,64,3]);
>> HSV=rgb2hsv(RGB);
>> H=HSV(:,:,1);
>> S=HSV(:,:,2);
>> V=HSV(:,:,3);
>> subplot(222)
>> imshow(H)
>> title('色调')
>> subplot(223)
>> imshow(V)
>> title('饱和度')
>> title('亮度')
>> imshow(S)
>> title('饱和度')
>> subplot(224)
>> imshow(V)
>> title('亮度')
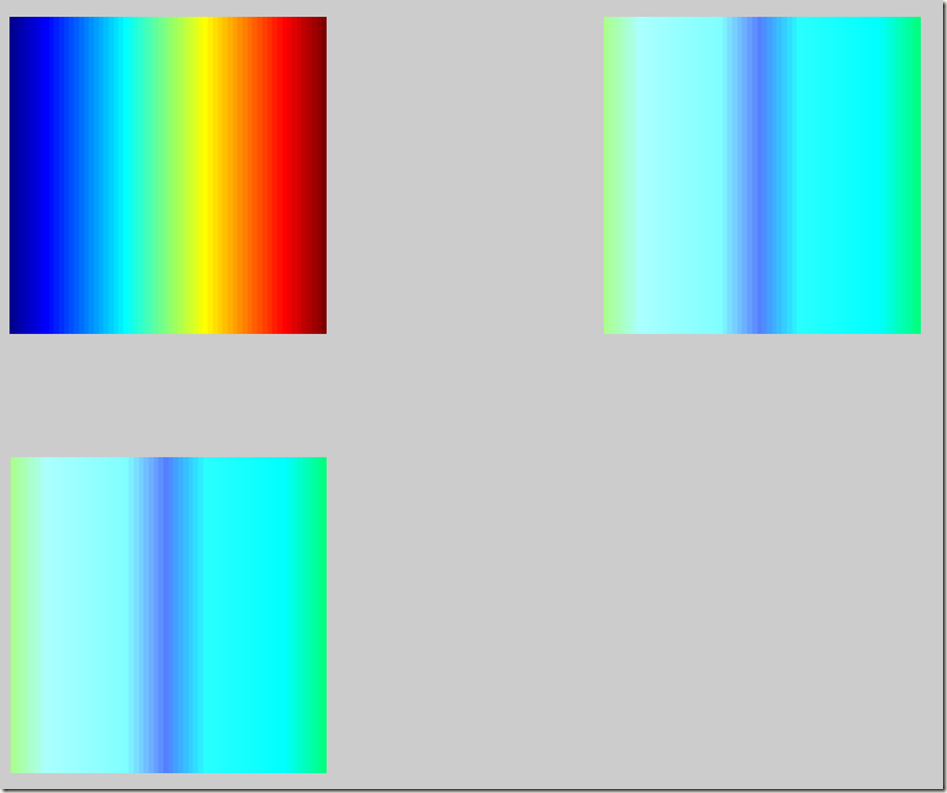
>> figure;subplot(221);imshow(RGB);
>> subplot(222);imshow(HSV);
>> q(:,:,1)=H;
??? Subscripted assignment dimension mismatch.
>> q(:,:,1)=H
??? Subscripted assignment dimension mismatch.
>> Q(:,:,1)=H;
??? Subscripted assignment dimension mismatch.
>> H=HSV(:,:,1);
>> q(:,:,1)=H
??? Subscripted assignment dimension mismatch.
>> H=HSV(:,:,1);
>> q(:,:,1)=H;
??? Subscripted assignment dimension mismatch.
>> size(H)
ans =
64 64
>> clear
>> RGB=reshape(ones(64,1)*reshape(jet(64),1,192),[64,64,3]);
>> HSV=rgb2hsv(RGB);
>> H=HSV(:,:,1);
>> q(:,:,1)=H;
>> H=HSV(:,:,2);
>> H=HSV(:,:,2);
>> H=HSV(:,:,1);
>> q(:,:,1)=H;
>> S=HSV(:,:,2);
>> q(:,:,2)=S;
>> V=HSV(:,:,3);
>> q(:,:,3)=V;
>> subplot(223);imshow(q);
>>


