不要使用最新的5.0版本安装4.0的
npm install echarts@4.9.0
main.js引入
import echarts from 'echarts'

Vue.prototype.$echarts = echarts
页面.vue
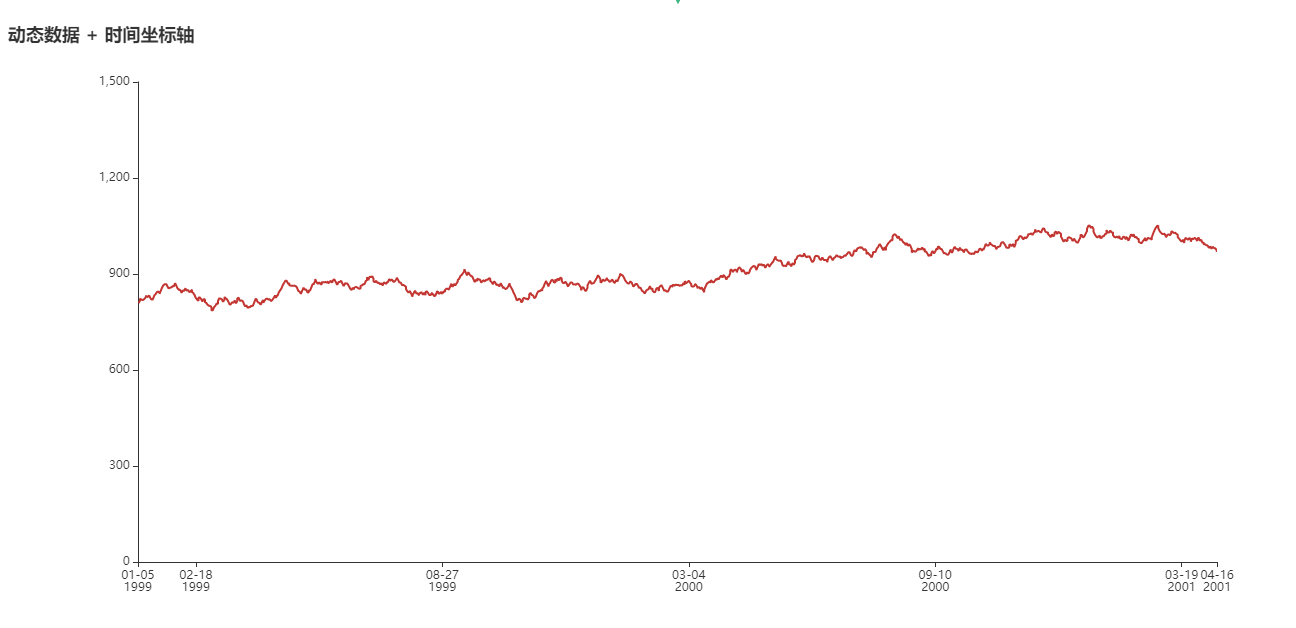
<template>
  <div id='myChart' style='width:600px;height:600px'>
</div>

</template>

<script>
 export default {
 name: 'hello',
 data () {
  return {
   data:[],
   now: new Date(1997,9,3),
   oneDay:24*3600*1000,
   value:Math.random()*1000
  }
 },
 mounted(){
  for (var i = 0; i < 1000; i++) {
    this.data.push(this.randomData());
  }
  this.drawLine();
  let that=this;
   let myChart = this.$echarts.init(document.getElementById('myChart'))
   this.timer = setInterval(function () {

      // 数据小于40的时候只添加,超过40的时候删除第一个
      // if(that.data.length<40){
      if(that.data.length<500){
        that.data.push(that.randomData());
      }else{
        for (var i = 0; i < 5; i++) {
          // console.log(that.data)
            that.data.shift();
            console.log(that.data)
            that.data.push(that.randomData());
        }
      }


      myChart.setOption({
          series: [{
              data: that.data
          }]
      });
  }, 1000);

 },
 created(){

 },
  beforeDestroy() {
    clearInterval(this.timer);
  },
 methods: {
   randomData() {
      this.now = new Date(+this.now + this.oneDay);
      this.value = this.value + Math.random() * 21 - 10;
      return {
          name: this.now.toString(),
          value: [
              [this.now.getFullYear(), this.now.getMonth() + 1, this.now.getDate()].join('/'),
              Math.round(this.value)
          ]
      };
  },
  drawLine(){
    // 基于准备好的dom,初始化echarts实例
    let myChart = this.$echarts.init(document.getElementById('myChart'))
    // 绘制图表
    myChart.setOption({title: {
        text: '动态数据 + 时间坐标轴'
    },
    tooltip: {
        trigger: 'axis',
        formatter: function (params) {
            params = params[0];
            var date = new Date(params.name);
            return date.getDate() + '/' + (date.getMonth() + 1) + '/' + date.getFullYear() + ' : ' + params.value[1];
        },
        axisPointer: {
            animation: false
        }
    },
    xAxis: {
        type: 'time',
        splitLine: {
            show: false
        }
    },
    yAxis: {
        type: 'value',
        boundaryGap: [0, '100%'],
        splitLine: {
            show: false
        }
    },
    series: [{
        name: '模拟数据',
        type: 'line',
        showSymbol: false,
        hoverAnimation: false,
        data: this.data
    }]
    });
  }
 }
}
</script>

<style scoped lang="less">

</style>