分别下载Filebeat和Elasticsearch,连个版本号保持一致
Elasticsearch:https://www.elastic.co/cn/downloads/past-releases/elasticsearch-7-17-1
Filebeat:https://www.elastic.co/cn/downloads/past-releases/filebeat-7-17-1
参考文献:
https://blog.csdn.net/qq_27512271/article/details/98740135
https://blog.csdn.net/wsdc0521/article/details/106236499
先安装Elasticsearch
准备3台机器
192.168.66.53 Elasticsearch01
192.168.66.54 Elasticsearch02
192.168.66.55 Elasticsearch03
解压下载的elasticsearch-7.17.1-linux-x86_64.tar.gz 文件
#解压当前目录
tar zxvf elasticsearch-7.17.1-linux-x86_64.tar.gz
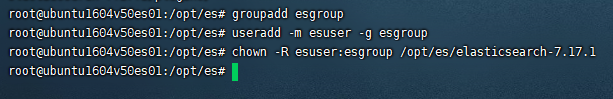
创建ES用户和组(创建elsearch用户组及elsearch用户),因为使用root用户执行ES程序,将会出现错误;所以这里需要创建单独的用户去执行ES 文件。
##添加用户组
groupadd esgroup
##添加用户到用户组
useradd -m esuser -g esgroup
##更改该文件夹下所属的用户组的权限,红色你自己的目录
chown -R esuser:esgroup /opt/es/elasticsearch-7.17.1
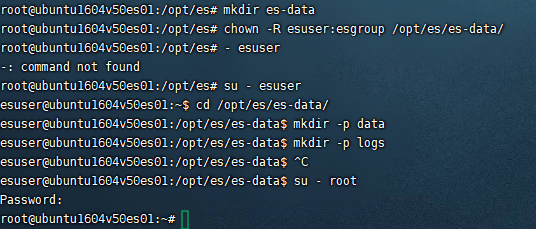
创建ES数据和日志文件目录
#创建data目录
mkdir es-data
#更改权限
chown -R esuser:esgroup /opt/es/es-data/
#切换用户
su - esuser
#创建数据文件夹和目录文件夹
cd /opt/es/es-data/
mkdir -p data
mkdir -p logs
#切回root用户
su - root
ES配置文件修改
vi /opt/es/elasticsearch-7.17.1/config/elasticsearch.yml
修改内容许下,3台机器标红地方要注意
# 设置集群名称,集群内所有节点的名称必须一致。
cluster.name: filebeat-es
# 设置节点名称,集群内节点名称必须唯一。
node.name: node1
# 表示该节点会不会作为主节点,true表示会;false表示不会
node.master: true
# 当前节点是否用于存储数据,是:true、否:false
node.data: true
# 索引数据存放的位置
path.data: /opt/es/es-data/data
# 日志文件存放的位置
path.logs: /opt/es/es-data/logs
# 需求锁住物理内存,是:true、否:false
#bootstrap.memory_lock: true
# 监听地址,用于访问该es
network.host: 192.168.66.53
# es对外提供的http端口,默认 9200
http.port: 9200
# TCP的默认监听端口,默认 9300
transport.tcp.port: 9300
# 设置这个参数来保证集群中的节点可以知道其它N个有master资格的节点。默认为1,对于大的集群来说,可以设置大一点的值(2-4)
discovery.zen.minimum_master_nodes: 2
# es7.x 之后新增的配置,写入候选主节点的设备地址,在开启服务后可以被选为主节点
discovery.seed_hosts: ["192.168.66.53:9300", "192.168.66.54:9300", "192.168.66.55:9300"]
discovery.zen.fd.ping_timeout: 1m
discovery.zen.fd.ping_retries: 5
# es7.x 之后新增的配置,初始化一个新的集群时需要此配置来选举master
cluster.initial_master_nodes: ["node1", "node2", "node3"]
# 是否支持跨域,是:true,在使用head插件时需要此配置
http.cors.enabled: true
# “*” 表示支持所有域名
http.cors.allow-origin: "*"
action.destructive_requires_name: true
action.auto_create_index: .security,.monitoring*,.watches,.triggered_watches,.watcher-history*
xpack.security.enabled: false
xpack.monitoring.enabled: true
xpack.graph.enabled: false
xpack.watcher.enabled: false
xpack.ml.enabled: false
#此版本将GeoIp功能默认开启了采集。在默认的启动下是会去官网的默认地址下获取最新的Ip的GEO信息。关闭
ingest.geoip.downloader.enabled: false
解决文件最大限制问题
vi /etc/security/limits.conf
文件末位追加
* soft nofile 65536
* hard nofile 65536
* soft nproc 65536
* hard nproc 65536
保存
修改vm.max_map_count大小(每次重启需要重新执行)
sysctl -w vm.max_map_count=655360

重启
启动ES,切换到elsearch用户,进入到bin 目录下执行 ./elasticsearch 命令就可以了,执行 ./elasticsearch -d 是后台运行
su - esuser
cd /opt/es/elasticsearch-7.17.1/bin/
#后台方式运行,不加d可以看到启动日志
./elasticsearch -d
#查看执行
jps

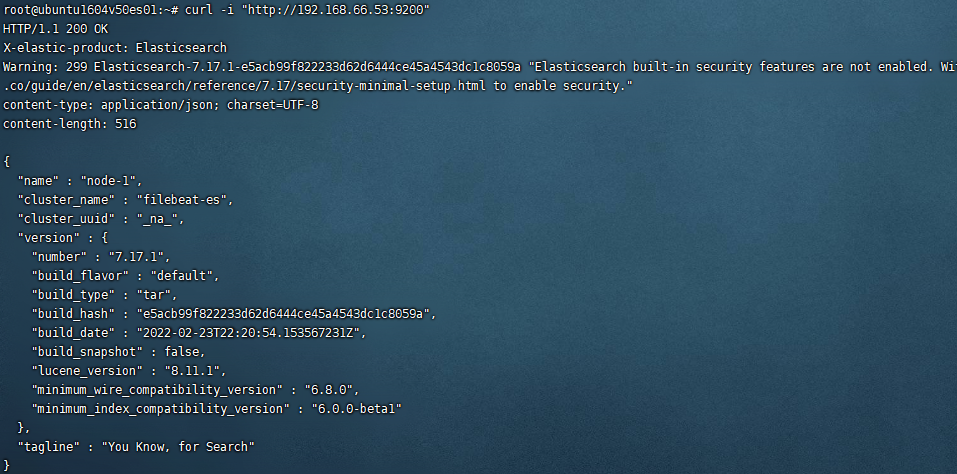
验证是否成功
curl -i "http://192.168.66.53:9200"
curl -i "http://192.168.66.54:9200"
curl -i "http://192.168.66.55:9200"
ElasticSearch7.x—head插件安装
参考:https://www.cnblogs.com/szwdun/p/10663813.html
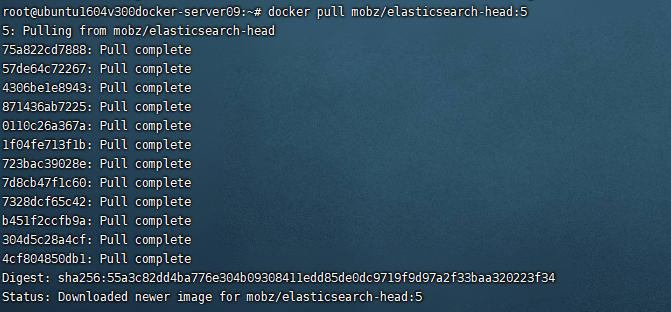
拉取镜像
docker pull mobz/elasticsearch-head:5
创建容器
docker create --name elasticsearch-head -p 9100:9100 mobz/elasticsearch-head:5

启动容器
docker start elasticsearch-head

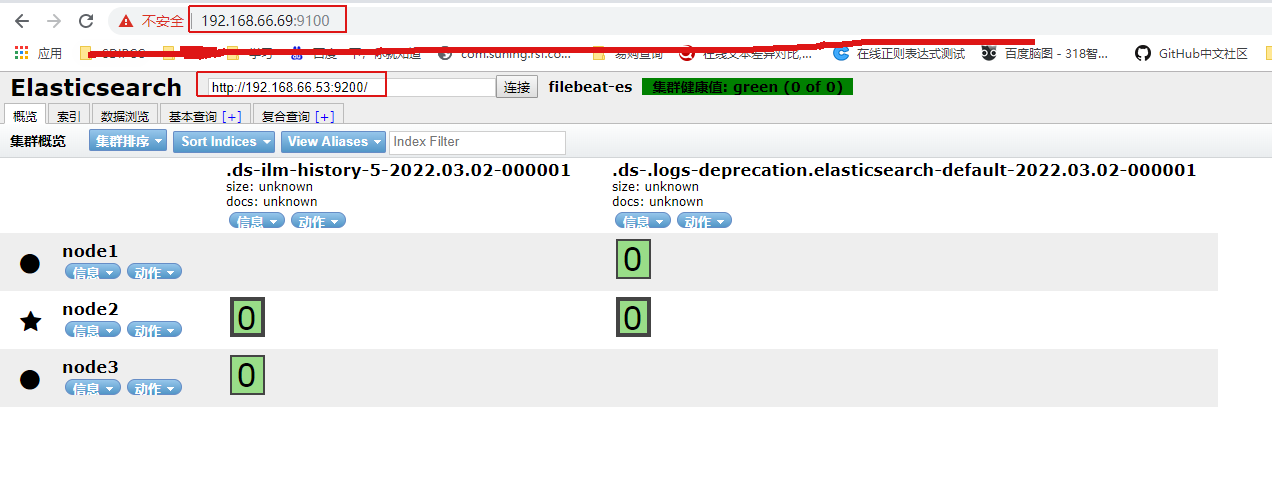
浏览器打开
http://{docker server ip}:9100
报这个错误,参考以下解决
{"error":"Content-Type header [application/x-www-form-urlencoded] is not supported","status":406}
https://blog.csdn.net/qq_37275405/article/details/103628230
Kibana(docker) 安装
#拉取镜像,跟ES版本保持一致
docker pull kibana:7.17.1
创建配置文件
vi /opt/kibana/config/kibana.yml
yml
erver.port: 5601 #这个不一定需要配置
server.host: "192.168.66.69" #配置IP
elasticsearch.hosts: ["192.168.66.53:9200" ,"192.168.66.54:9200" ,"192.168.66.55:9200"] #es的地址
i18n.locale: "zh-CN" #默认是英文,这个是中文设置
#运行docker镜像
docker run -d --name=kibana --restart=always -p 5601:5601 -v /opt/kibana/config/kibana.yml:/usr/share/kibana/config/kibana.yml kibana:7.17.1
#查看日志
docker logs -f kibana
浏览器访问
http://192.168.66.69:5601
Filebeat 导入 Elastaticsearch 的方法
参考:
https://www.elastic.co/guide/en/beats/filebeat/7.17/elasticsearch-output.html 官网文档
https://www.cnblogs.com/cjsblog/p/9495024.html 详解
https://www.cnblogs.com/Yemilice/p/10253876.html
https://blog.csdn.net/cui929434/article/details/94390332
https://www.cnblogs.com/firstdown/p/10034691.html
https://baijiahao.baidu.com/s?id=1715644077012145335&wfr=spider&for=pc
https://www.shuzhiduo.com/A/l1dyZYx9ze/
https://www.cnblogs.com/bigberg/p/13551987.html
解压filebeat压缩文件
tar xzvf filebeat-7.17.1-linux-x86_64.tar.gz
#修改配置文件,配置采集到ES
vi /opt/filebeat/filebeat-7.17.1-linux-x86_64/filebeat.yml
# ============================== Filebeat inputs ===============================
filebeat.inputs:
- type: log
  enabled: true
  paths:
    - /tmp/logs/x-gateway/x-gateway-info.log
  fields:
    source: x-gateway-info
  multiline.pattern: '^[0-9]{4}-[0-9]{2}-[0-9]{2}'
  multiline.negate: true
  multiline.match: after
- type: log
  enabled: true
  paths:
    - /tmp/logs/xd-common-server/xd-common-server-info.log
  fields:
    source: xd-common-server
  multiline.pattern: '^[0-9]{4}-[0-9]{2}-[0-9]{2}'
  multiline.negate: true
  multiline.match: after
- type: log
  enabled: true
  paths:
    - /tmp/logs/xd-member/xd-member-info.log
  fields:
    source: xd-member-info
  multiline.pattern: '^[0-9]{4}-[0-9]{2}-[0-9]{2}'
  multiline.negate: true
  multiline.match: after

# ============================== Filebeat modules ==============================
filebeat.config.modules:
  path: ${path.config}/modules.d/*.yml
  reload.enabled: true
setup.template.settings:
  index.number_of_shards: 3
setup.ilm.enabled: false


setup.kibana:
  hosts: "192.168.66.69:5601"
# ---------------------------- Elasticsearch Output ----------------------------
output.elasticsearch:
  hosts: ["192.168.66.53:9200", "192.168.66.54:9200", "192.168.66.55:9200"]
  enabled: true
  indices:
    - index: "x-gateway-info"
      when.equals:
        fields:
            source: "x-gateway-info"
    - index: "xd-common-server"
      when.equals:
        fields:
            source: "xd-common-server"
    - index: "xd-member-info"
      when.equals:
        fields:
            source: "xd-member-info"
配置好以后先去es创建索引,不然引发索引不存在,不知道为啥,索引不会自动创建
2种运行方式
#后台运行
nohup /opt/filebeat/filebeat-7.17.1-linux-x86_64/filebeat -e -c /opt/filebeat/filebeat-7.17.1-linux-x86_64/filebeat.yml  > /dev/null 2>&1 &
#查询运行
ps -ef | grep filebeat


#当前会话运行
cd /opt/filebeat/filebeat-7.17.1-linux-x86_64/
./filebeat -e -c filebeat.yml
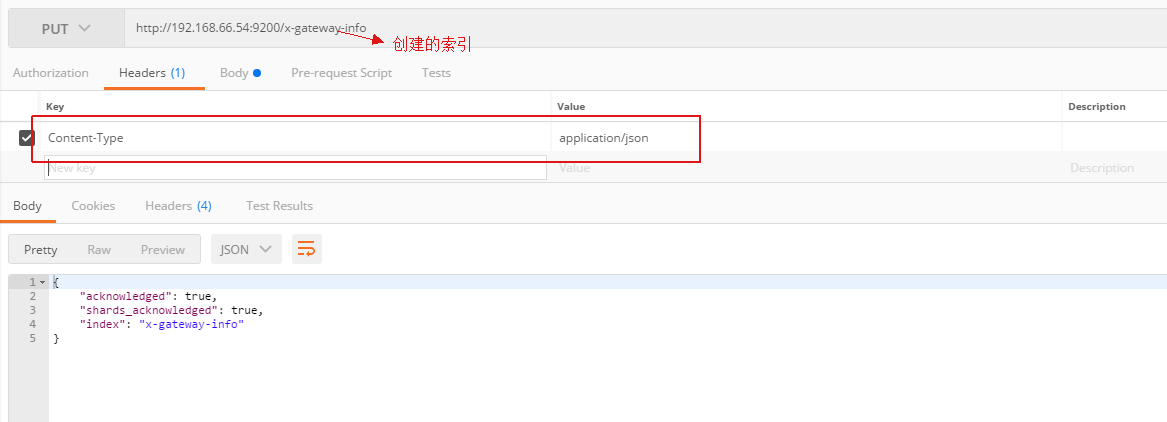
通过postman来创建索引,注意,head的自己测试不是很稳定,建议自己写语句去postman来查询
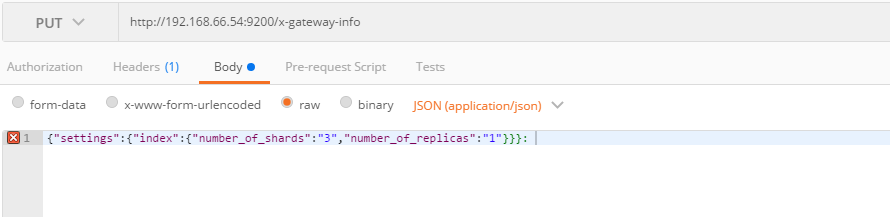
http://192.168.66.54:9200/x-gateway-info
{
	"settings": {
		"index": {
			"number_of_shards": "3",
			"number_of_replicas": "1"
		}
	}
}
查询某个索引信息
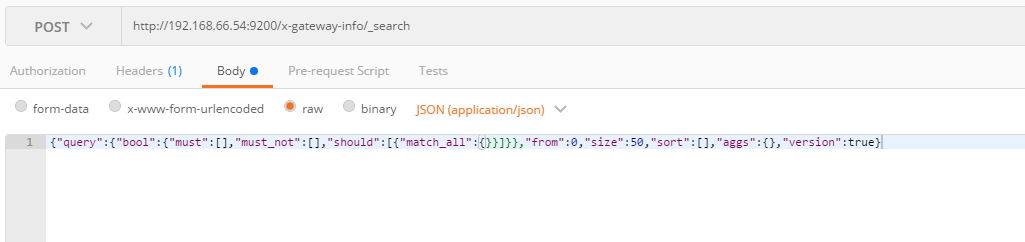
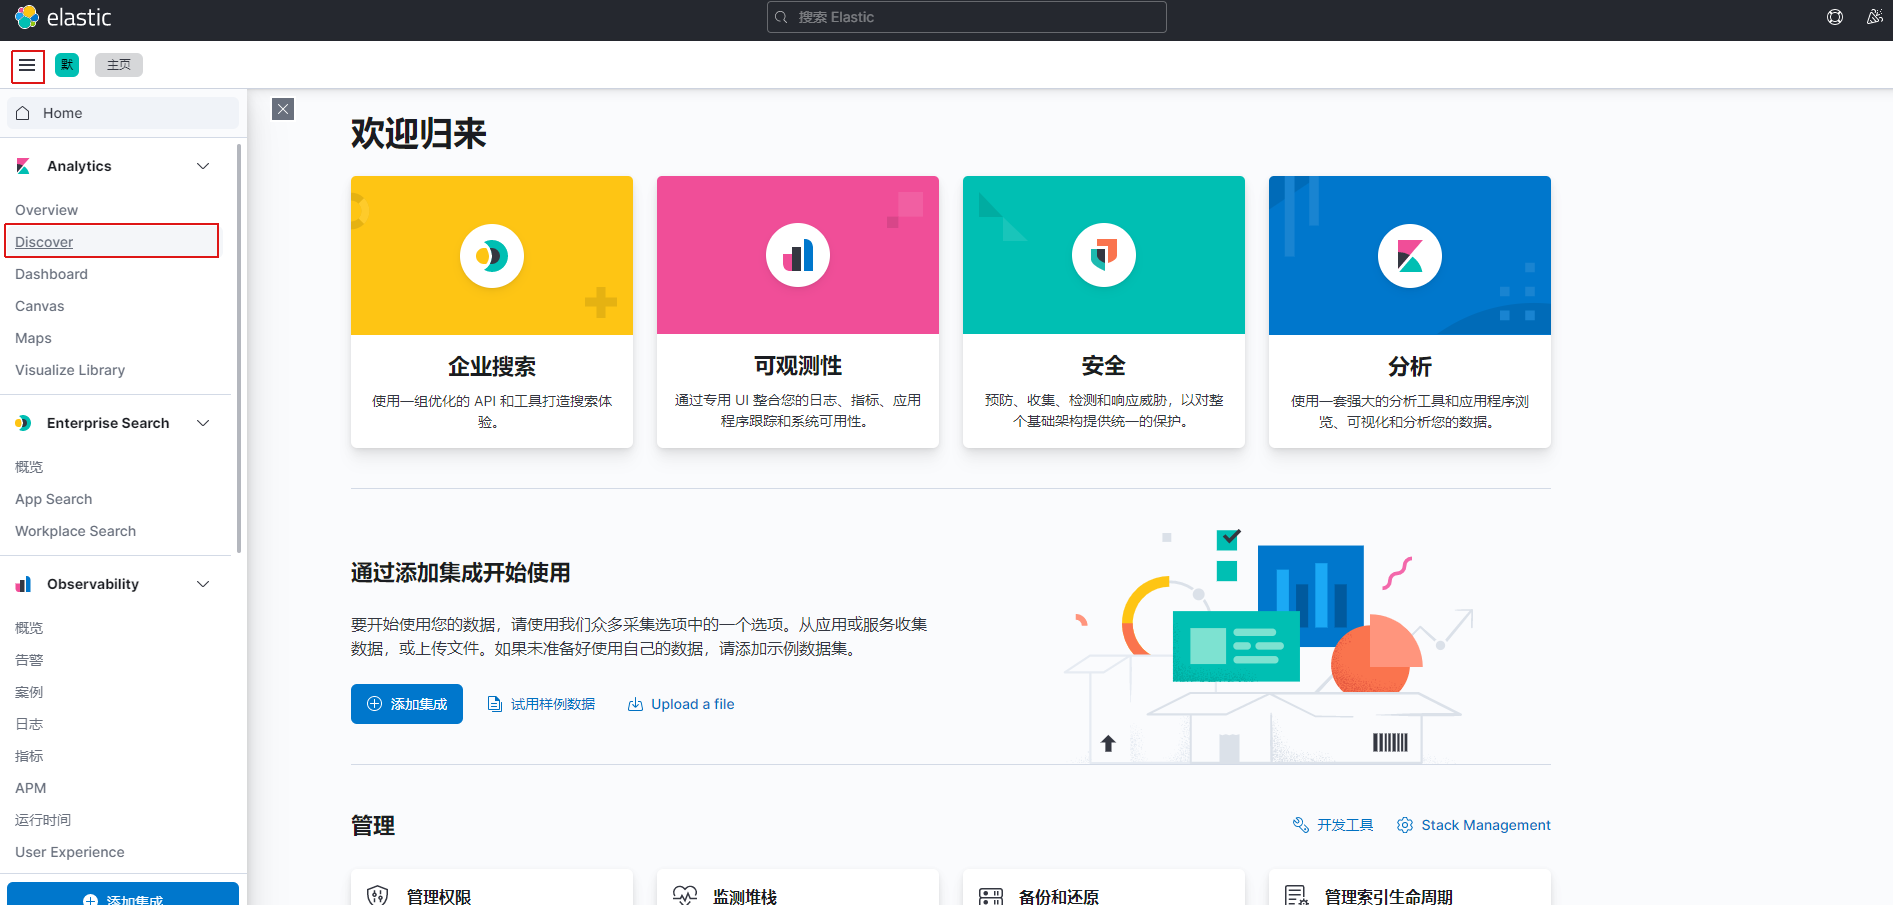
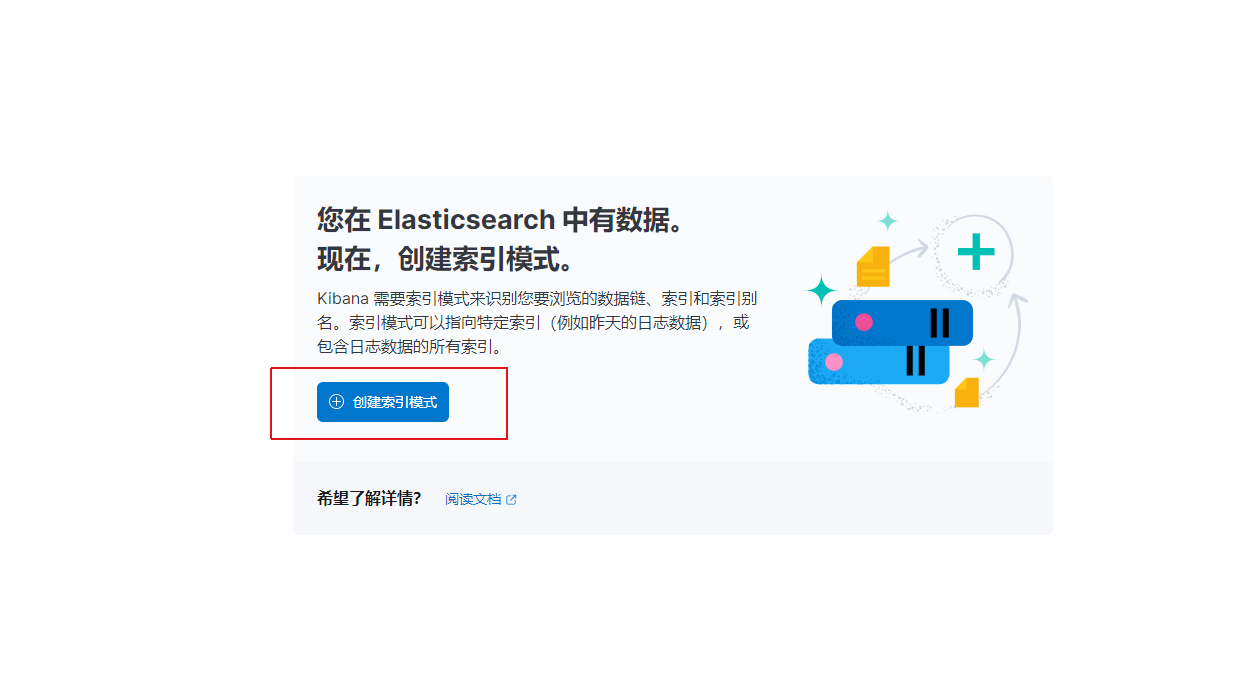
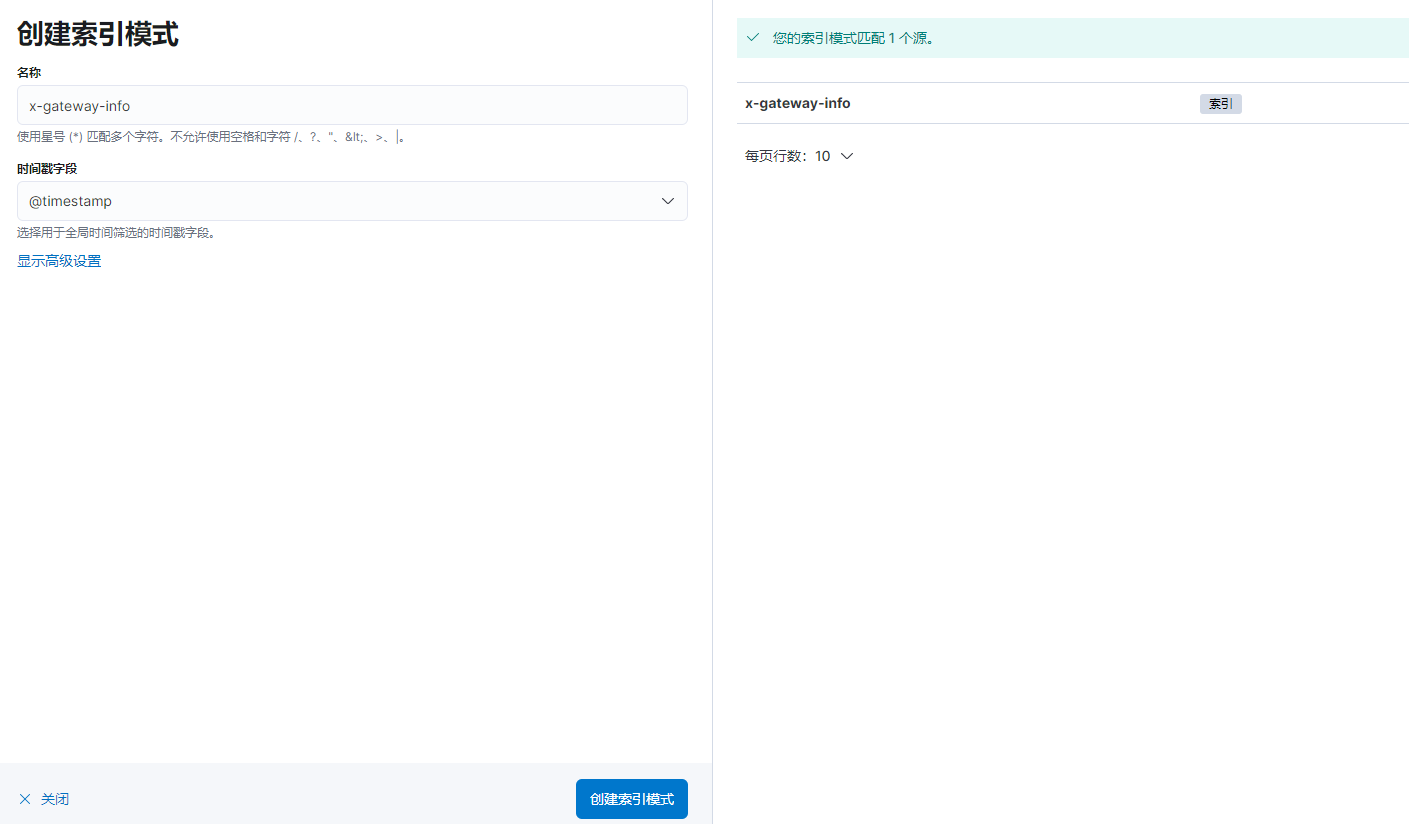
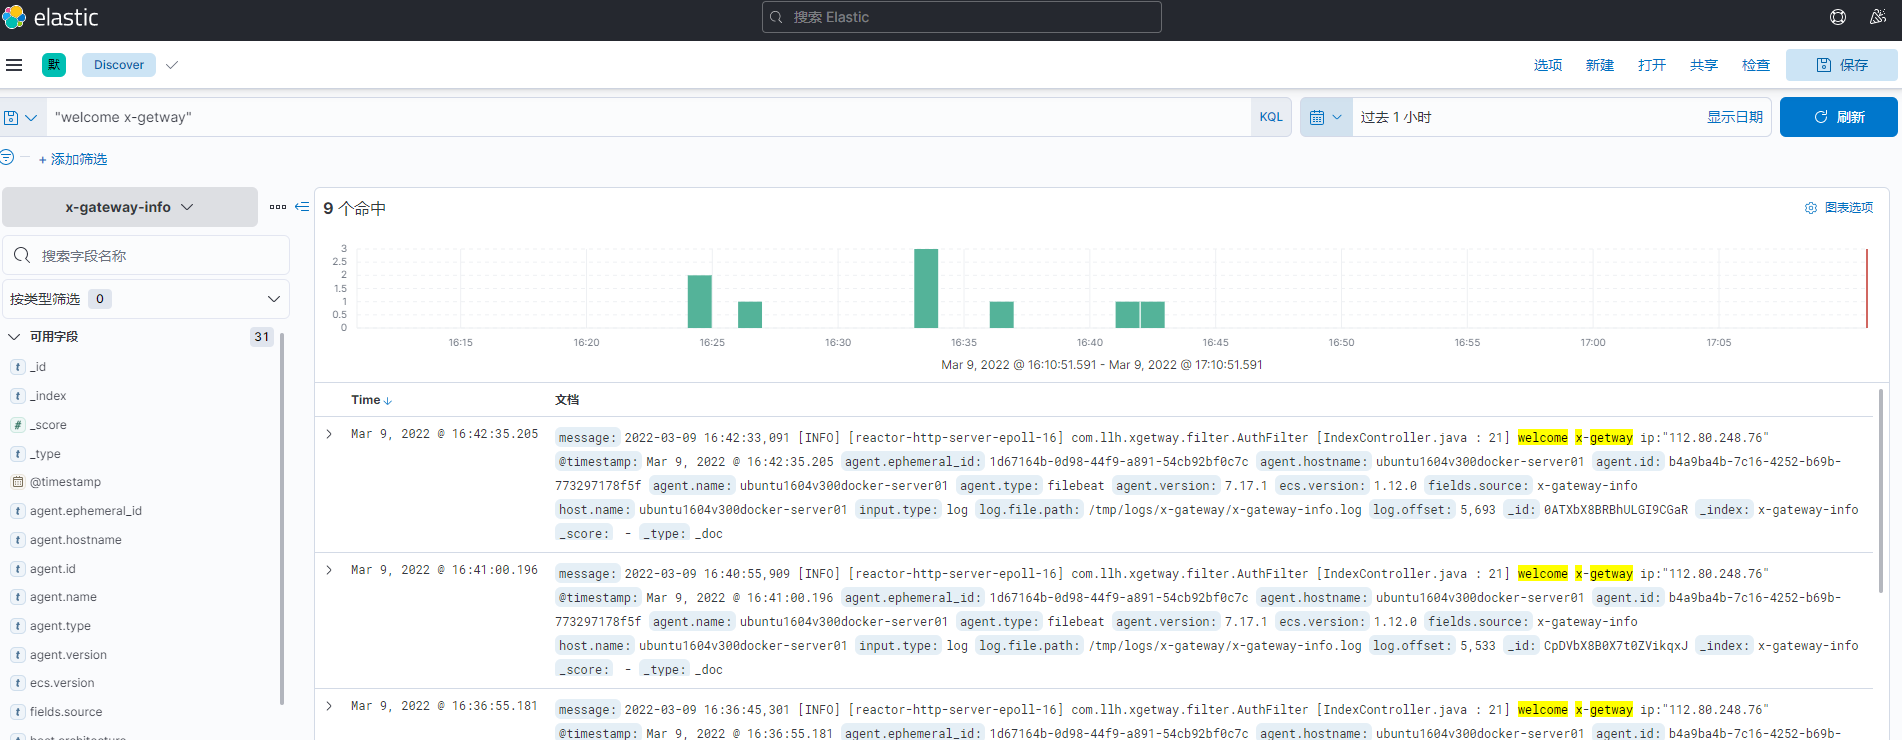
有数据以后去Kibana创建查询
http://192.168.66.69:5601/app/home#/