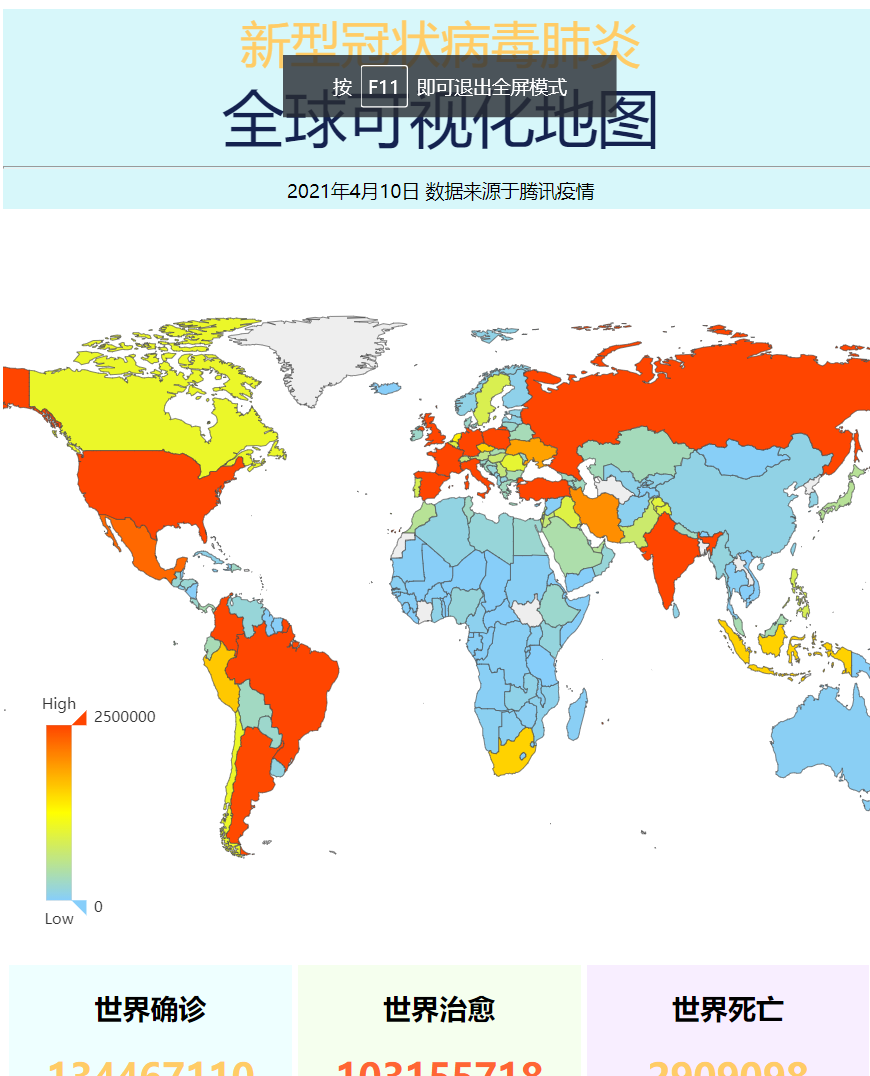
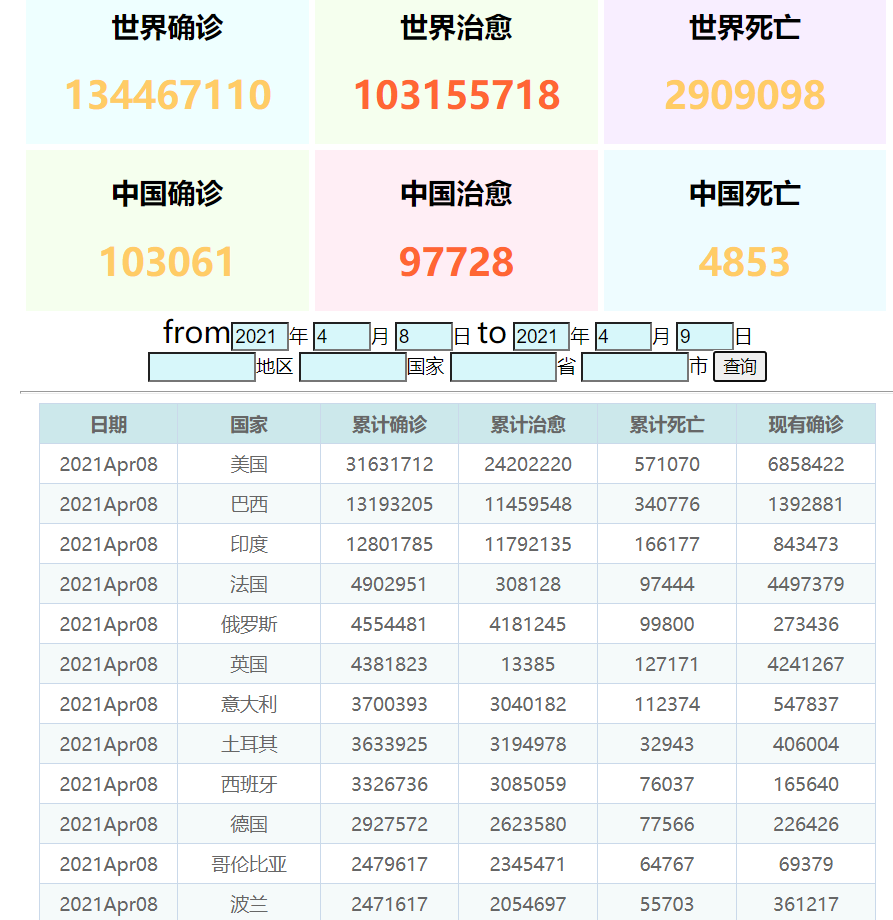
今日主要完成全球疫情可视化手机端页面的展示,参考腾讯疫情手机端界面。
基本与pc端的一样,修改一下div就可以,一般将div居中,并将字体适当放大。
css部分:
.app{
    text-align:center;
}
header{
    text-align: center;
    height: 160px;
    width: 700px;
    background-size: 100% 100%;
    background: #d7f7fa;
}
header .title1{
    font-size: 40px;
    color: #ffcc66;
}
header .title2{
    font-size: 50px;
    color: #14224f;
}
.data .datadiv{
    width: 700px;
}
.data .datadiv .dataclassdiv{
    width: 226px;
    float: left;
    margin-left: 5px;
    margin-top: 5px;
}
.column{
    height: 600px;
}
.column .map{
    width: 700px;
    height: 600px;
}
.column .map .chart{
    width: 700px;
    height: 600px;
}
.from{
     width: 700px;
}
.from .fromquery{
    z-index:3;
}

.from .fromquery .date {
    background: #d7f7fa;
    padding: 1px;
    width: 40px;
    font-size: 15px;
    font-weight: 300;
}

.from .fromquery .area {
    background: #d7f7fa;
    padding: 1px;
    width: 80px;
    font-size: 15px;
    font-weight: 300;
}

table {
    border-collapse: collapse;
    margin: 0 auto;
    text-align: center;
}
table td, table th {
    border: 1px solid #cad9ea;
    color: #666;
    height: 30px;
}
table thead tr th {
    background-color: #CCE8EB;
    width: 100px;
}
table tr:nth-child(odd) {
    background: #fff;
}
table tr:nth-child(even) {
    background: #F5FAFA;
}
html部分:
<!DOCTYPE html>
<html lang="en">
<head>
    <meta charset="UTF-8">
    <title>Title</title>
    <link rel="stylesheet" href="../static/css/android.css" />
</head>

<script type="text/javascript" src="https://webapi.amap.com/maps?v=1.4.15&key=08124b72c34a9f80f54d3aab0645f817"></script>
<script type="text/javascript" src="https://webapi.amap.com/maps?v=1.4.15&key=08124b72c34a9f80f54d3aab0645f817&plugin=AMap.DistrictSearch"></script>
<script src="https://webapi.amap.com/ui/1.0/main.js"></script>
<script src="https://cdn.bootcss.com/PapaParse/4.1.2/papaparse.min.js"></script>
<script src="../static/js/jquery.js"></script>
<script src="../static/js/echarts.min.js"></script>
<script src="../static/js/china.js"></script>
<script src="../static/js/flexible.js"></script>
<script src="../static/js/world.js"></script>

<body class="app">
<div align="center">
    <header>
        <font class="title1">新型冠状病毒肺炎</font><br>
        <font class="title2">全球可视化地图</font><br><hr/>
        <font class="showTime">2020年4月1日</font>
        <font class="data">数据来源于腾讯疫情</font>
        <script>
            var t = null;
            t = setTimeout(time, 1000); //開始运行
            function time() {
                clearTimeout(t); //清除定时器
                dt = new Date();
                var y = dt.getFullYear();
                var mt = dt.getMonth() + 1;
                var day = dt.getDate();
                //var h = dt.getHours(); //获取时
                //var m = dt.getMinutes(); //获取分
                //var s = dt.getSeconds(); //获取秒
                document.querySelector(".showTime").innerHTML = y + "年" + mt + "月" + day+"日";
                t = setTimeout(time, 1000); //设定定时器,循环运行
            }
        </script>
    </header>
</div>
<div align="center" class="column">
    <div class="map" id="chart-panel">
        <div class="chart" id="map"></div>
    </div>
</div>
<div align="center">
    <div align="center" class="data">
        <div class="datadiv">
            <div class="dataclassdiv" style="background: #EEFFFF">
                <h2>世界确诊</h2>
                <h1 id="world_confirm" style="color:#ffcc66">2000000</h1>
            </div>
            <div class="dataclassdiv" style="background: #F5FFEE">
                <h2>世界治愈</h2>
                <h1 id="world_heal" style="color:#ff6633">2000000</h1>
            </div>
            <div class="dataclassdiv" style="background: #F8EEFF">
                <h2>世界死亡</h2>
                <h1 id="world_dead" style="color:#ffcc66">2000000</h1>
            </div>
        </div>
        <div class="datadiv">
            <div class="dataclassdiv" style="background: #F5FFEE">
                <h2>中国确诊</h2>
                <h1 id="confirm" style="color:#ffcc66">2000000</h1>
            </div>
            <div class="dataclassdiv" style="background: #FFEEF5">
                <h2>中国治愈</h2>
                <h1 id="heal" style="color:#ff6633">2000000</h1>
            </div>
            <div class="dataclassdiv" style="background: #EEFCFF">
                <h2>中国死亡</h2>
                <h1 id="dead" style="color:#ffcc66">2000000</h1>
            </div>
        </div>
    </div>
</div>
<div></div>
<div align="center">
    <div class="from">
        <div class="fromquery">
            <font id="text" size="5px">from</font><input type="text" id="fromyear" class="date">年
            <input type="text" id="frommounth" class="date">月
            <input type="text" id="fromday" class="date">日
            <font id="text" size="5px">to</font>
            <input type="text" id="toyear" class="date">年
            <input type="text" id="tomounth" class="date">月
            <input type="text" id="today" class="date">日<br>
            <input type="text" id="continent" class="area">地区
            <input type="text" id="country" class="area">国家
            <input type="text" id="province" class="area">省
            <input type="text" id="city" class="area">市
            <Button id="query2" >查询</Button>
            <hr>
            <div class="map-table">
                <table>
                    <thead>
                    </thead>
                    <tbody>
                    </tbody>
                </table>
            </div>
        </div>
    </div>
</div>
<script>
        function all(){
            $.ajax({
                url: "/all_world",
                success: function (data) {},
                error: function (xhr, type, errorThrown) {}
            })
        }
        //all()
</script>
<script>中国地图部分</script>
<script>世界地图部分</script>

