d3最新是V5版的,比起V2的API变动了不少,写下我实现过程
效果图:
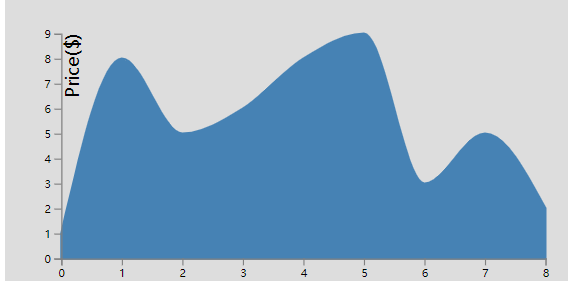
面积图:
折线图:

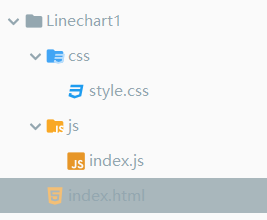
目录结构:


<!DOCTYPE html>
<html lang="en">
<head>
    <meta charset="UTF-8">
    <link href="css/style.css" media="screen" rel="stylesheet" type="text/css"/>
    <title>Linechart1</title>
</head>
<body>
    <div id="container"></div>

    <script src="https://d3js.org/d3.v5.min.js"></script>
    <script src="js/index.js"></script>
</body>
</html>
#container{
    background: #ddd;
     500px;
    height: 250px;
}

path{
    fill: none;
    stroke: steelblue;
    stroke- 2;
}

.domain ,.tick line{
    stroke:gray;
    stroke- 1;
}
var width=500,height=250,
    margin={left:50,top:30,right:20,bottom:20},
    g_width=width-margin.left-margin.right,
    g_height=height-margin.top-margin.bottom;

//svg
d3.select("#container").append("svg")
    //width,height
    .attr("width",width)
    .attr("height",height)

var g=d3.select("svg")
    .append("g")
    .attr("transform","translate("+margin.left+","+margin.top+")");

var data=[1,8,5,6,8,9,3,5,2]
//Scale
var scale_x=d3.scaleLinear()
    .domain([0,data.length-1])
    .range([0,g_width]);
var scale_y=d3.scaleLinear()
    .domain([0,d3.max(data)])
    .range([g_height,0]);

//画线函数
var line_generator= d3.line()
    .x(function (d,i) {
        return scale_x(i);
    })
    .y(function (d) {
        return scale_y(d);
    })
    .curve(d3.curveMonotoneX)
    // .curve(d3.curveMonotoneX) // apply smoothing to the line

//画路径
g.append("path")
    .attr("d",line_generator(data)) //d="M1,0L20,40.....  d-path data

// //画面积函数
// var area_generator= d3.area()
//     .x(function (d,i) {
//         return scale_x(i);
//     })
//     .y0(g_height)
//     .y1(function (d) {
//         return scale_y(d);
//     })
//     .curve(d3.curveMonotoneX)
//
// //画面积
// g.append("path")
//     .attr("d",area_generator(data)) //d="M1,0L20,40.....  d-path data
//     .style("fill","steelblue")


//X轴
g.append("g")
    .call(d3.axisBottom(scale_x))
    .attr("transform","translate(0,"+g_height+")")

//Y轴
g.append("g")
    .call(d3.axisLeft(scale_y))

//y轴文字
g.append("text")
    .text("Price($)")
    .attr("transform","rotate(-90)")
    .attr("dy","1em")
    .attr("text-anchor","end")
其中,使用红色部分,注释绿色部分是面积图
使用绿色部分,注释红色部分是折线图
data数组是数据来源。
参考教程:https://www.imooc.com/learn/103