Hierarchy Viewer默认打开“Tree View”窗口无法显示显示Performance indicators:

但选中根视图再点击按钮“Obtain layout times for tree rooted at selected node”:

就可以显示:
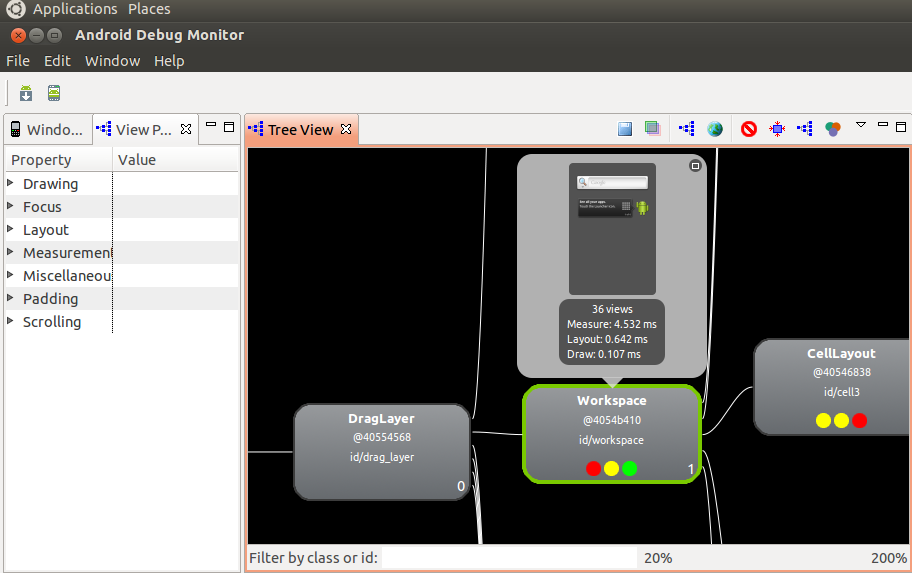
其上该视图性能的颜色指示符从左到右依次为:Measure、Layout和Draw,其中红色代表此树中该视图渲染最慢即占用总渲染时间的80%或其以上,绿色代表此树中该视图渲染时长小于总渲染时间的50%,黄色代表此树种该视图渲染时长50%或其以上但低于80%。
View Codepublic class ProfileNodesAction extends SelectedNodeEnabledAction implements ImageAction {
...
public ProfileNodesAction() {
        super("Profile Node");
        ImageLoader imageLoader = ImageLoader.getLoader(HierarchyViewerDirector.class);
        mImage = imageLoader.loadImage("profile.png", Display.getDefault()); //$NON-NLS-1$
        setImageDescriptor(ImageDescriptor.createFromImage(mImage));
        setToolTipText("Obtain layout times for tree rooted at selected node");
    }
...
@Override
    public void run() {
        HierarchyViewerDirector.getDirector().profileCurrentNode();
    }
...
View Codepublic void profileCurrentNode() {
        final DrawableViewNode selectedNode = TreeViewModel.getModel().getSelection();
        if (selectedNode != null) {
            executeInBackground("Profile Node", new Runnable() {
                @Override
                public void run() {
                    IHvDevice hvDevice = getHvDevice(selectedNode.viewNode.window.getDevice());
                    hvDevice.loadProfileData(selectedNode.viewNode.window, selectedNode.viewNode);
                    // Force the layout viewer to redraw.
                    TreeViewModel.getModel().notifySelectionChanged();
                }
            });
        }
    }
View Codepublic static boolean loadProfileData(Window window, ViewNode viewNode) {
        DeviceConnection connection = null;
        try {
            connection = new DeviceConnection(window.getDevice());
            connection.sendCommand("PROFILE " + window.encode() + "" + viewNode.toString()); //$NON-NLS-1$
            BufferedReader in = connection.getInputStream();
            int protocol;
            synchronized (sViewServerInfo) {
                protocol = sViewServerInfo.get(window.getDevice()).protocolVersion;
            }
            if (protocol < 3) {
                return loadProfileData(viewNode, in);
            } else {
                boolean ret = loadProfileDataRecursive(viewNode, in);
                if (ret) {
                    viewNode.setProfileRatings();
                }
                return ret;
            }
        } catch (Exception e) {
            Log.e(TAG, "Unable to load profiling data for window " + window.getTitle()
                    + " on device " + window.getDevice());
        } finally {
            if (connection != null) {
                connection.close();
            }
        }
        return false;
    }

private static boolean loadProfileData(ViewNode node, BufferedReader in) throws IOException {
        String line;
        if ((line = in.readLine()) == null || line.equalsIgnoreCase("-1 -1 -1") //$NON-NLS-1$
                || line.equalsIgnoreCase("DONE.")) { //$NON-NLS-1$
            return false;
        }
        String[] data = line.split("");
        node.measureTime = (Long.parseLong(data[0]) / 1000.0) / 1000.0;
        node.layoutTime = (Long.parseLong(data[1]) / 1000.0) / 1000.0;
        node.drawTime = (Long.parseLong(data[2]) / 1000.0) / 1000.0;
        return true;
    }

    public static boolean loadProfileDataRecursive(ViewNode node, BufferedReader in)
            throws IOException {
        if (!loadProfileData(node, in)) {
            return false;
        }
        for (int i = 0; i < node.children.size(); i++) {
            if (!loadProfileDataRecursive(node.children.get(i), in)) {
                return false;
            }
        }
        return true;
    }
View Codepublic class ViewNode {

    public static enum ProfileRating {
        RED, YELLOW, GREEN, NONE
    };

    private static final double RED_THRESHOLD = 0.8;

    private static final double YELLOW_THRESHOLD = 0.5;
...

public void setProfileRatings() {
        final int N = children.size();
        if (N > 1) {
            double totalMeasure = 0;
            double totalLayout = 0;
            double totalDraw = 0;
            for (int i = 0; i < N; i++) {
                ViewNode child = children.get(i);
                totalMeasure += child.measureTime;
                totalLayout += child.layoutTime;
                totalDraw += child.drawTime;
            }
            for (int i = 0; i < N; i++) {
                ViewNode child = children.get(i);
                if (child.measureTime / totalMeasure >= RED_THRESHOLD) {
                    child.measureRating = ProfileRating.RED;
                } else if (child.measureTime / totalMeasure >= YELLOW_THRESHOLD) {
                    child.measureRating = ProfileRating.YELLOW;
                } else {
                    child.measureRating = ProfileRating.GREEN;
                }
                if (child.layoutTime / totalLayout >= RED_THRESHOLD) {
                    child.layoutRating = ProfileRating.RED;
                } else if (child.layoutTime / totalLayout >= YELLOW_THRESHOLD) {
                    child.layoutRating = ProfileRating.YELLOW;
                } else {
                    child.layoutRating = ProfileRating.GREEN;
                }
                if (child.drawTime / totalDraw >= RED_THRESHOLD) {
                    child.drawRating = ProfileRating.RED;
                } else if (child.drawTime / totalDraw >= YELLOW_THRESHOLD) {
                    child.drawRating = ProfileRating.YELLOW;
                } else {
                    child.drawRating = ProfileRating.GREEN;
                }
            }
        }
        for (int i = 0; i < N; i++) {
            children.get(i).setProfileRatings();
        }
    }
View Code/**
 * This class is used for connecting to a device in debug mode running the view
 * server.
 */
public class DeviceConnection {
...
public void sendCommand(String command) throws IOException {
        BufferedWriter out = getOutputStream();
        out.write(command);
        out.newLine();
        out.flush();
    }
...
View Code