资源清单
| 主机 | IP |
|---|---|
| Prometheus + Grafana | 10.0.0.1 |
| 软件 | 版本 |
|---|---|
| docker | 20.10.12 |
| docker-compose | 1.23.1 |
| Prometheus | 2.18.1 |
| Grafana | 7.2.1 |
| Pushgateway | 1.4.2 |
| Alertmanager | 0.11.0 |
| node-exporter | 1.3.1 |
一、Docker 安装
1. 使用国内 yum 源
# yum install -y yum-utils device-mapper-persistent-data lvm2
# yum-config-manager --add-repo https://mirrors.aliyun.com/docker-ce/linux/centos/docker-ce.repo
2. 卸载旧版本的 docker
## 如果主机上已经有docker存在且不是想要安装的版本,需要先进行卸载。
# yum remove -y docker \
              docker-client \
              docker-client-latest \
              docker-common \
              docker-latest \
              docker-latest-logrotate \
              docker-logrotate \
              docker-selinux \
              docker-engine-selinux \
              docker-engine \
              container*
3. 安装 Docker20.10 版本
# yum -y install docker-ce-20.10.12-3.el7 docker-ce-cli-20.10.12-3.el7
4. 设置镜像加速
# mkdir /etc/docker
# vi /etc/docker/daemon.json

{
  "registry-mirrors": ["https://xxxxxxxxx.mirror.aliyuncs.com"]
}
5. 启动 docker
# systemctl start docker
# systemctl enable docker
# systemctl status docker
二、Docker-compose 安装
1. Docker-compose 安装
## github.com 可能访问超时,可以使用下面的获取下载下来后上传服务器即可
# curl -L "https://github.com/docker/compose/releases/download/1.29.2/docker-compose-$(uname -s)-$(uname -m)" -o /usr/local/bin/docker-compose

# curl -k "https://dl.cactifans.com/zabbix_docker/docker-compose" -o /usr/bin/docker-compose

# chmod a+x /usr/bin/docker-compose
2. 查看 docker-compose 版本
# docker-compose version
三、安装 prometheus + grafana + pushgateway
1. 获取 docker-compose.yaml
## 使用下面的开源项目,可以跳过这个步骤,使用下面的 docker-compose.yaml 文件
# cd /opt/
# git clone https://github.com/evnsio/prom-stack.git
# cd prom-stack
2. 编辑 docker-compose.yml 文件
version: "3"
services:

  pushgateway:
    #image: prom/pushgateway:v0.4.0
    image: prom/pushgateway:v1.4.2
    container_name: pushgateway
    command: --persistence.file=/pushgateway/pushgateway.data
    ports:
      - 9091:9091
    volumes:
      - /data/pushgateway:/pushgateway

  prometheus:
    #image: prom/prometheus:v2.0.0
    image: prom/prometheus:v2.18.1
    container_name: prometheus
    command: --config.file=/etc/prometheus/prometheus.yml --storage.tsdb.path=/prometheus --storage.tsdb.retention=30d
    user: 0:0
    ports:
      - 9090:9090
    volumes:
      - /data/prometheus/prometheus.yml:/etc/prometheus/prometheus.yml
      - /data/prometheus/alerts/:/etc/prometheus/rules.d/
      - /data/prometheus/data/:/prometheus

  grafana:
    #image: grafana/grafana:4.6.2
    image: grafana/grafana:7.2.1
    container_name: grafana
    ports:
      - 3000:3000
    volumes:
      - /data/grafana:/var/lib/grafana
    environment:
      - GF_SECURITY_ADMIN_PASSWORD=admin

  alertmanager:
    image: prom/alertmanager:v0.11.0
    container_name: alertmanager
    command: --config.file=/etc/alertmanager/alertmanager.yml
    ports:
      - 9093:9093
    volumes:
      - /data/alertmanager/alertmanager.yml:/etc/alertmanager/alertmanager.yml

###############node-exporter###############
  node-exporter:
    image: "prom/node-exporter:v1.3.1"
    #hostname: node-exporter
    container_name: node-exporter
    ports:
      - '9100:9100'
    volumes:
      - /etc/localtime:/etc/localtime:ro
      - /proc:/host/proc:ro
      - /sys:/host/sys:ro
      - /:/rootfs:ro
      - /etc/hostname:/etc/hostname:ro
    restart: always
    network_mode: host
    command:
      - '--path.procfs=/host/proc'
      - '--path.sysfs=/host/sys'
      - '--path.rootfs=/rootfs'
3. 创建服务挂载目录
# mkdir -pv /data/{pushgateway,prometheus,alertmanager,grafana}

# mkdir /data/prometheus/{alerts,data}


## 设置grafana持久化存储文件权限
# chown 472:472 -R /data/grafana/
4. 编辑配置文件
a | prometheus.yml
# vim /data/prometheus/prometheus.yml

# my global config
global:
  scrape_interval:     15s # Set the scrape interval to every 15 seconds. Default is every 1 minute.
  evaluation_interval: 15s # Evaluate rules every 15 seconds. The default is every 1 minute.
  # scrape_timeout is set to the global default (10s).

  # Attach these labels to any time series or alerts when communicating with
  # external systems (federation, remote storage, Alertmanager).
  external_labels:
      monitor: 'edocyun-prom-stack'

# Alertmanager configuration
alerting:
  alertmanagers:
  - static_configs:
    - targets:
      - alertmanager:9093

# Load rules once and periodically evaluate them according to the global 'evaluation_interval'.
rule_files:
  # - "first_rules.yml"
  # - "second_rules.yml"

scrape_configs:
  - job_name: 'prom-stack'
    static_configs:
      - targets:
        - prometheus:9090
        - pushgateway:9091
        - alertmanager:9093
        - grafana:3000

  - job_name: 'node-exporter'
    static_configs:
      - targets:
        - 10.0.0.1:9100  ## 需要主机部署 node-exporter 服务
b | alertmanager.yml
# vim  /data/alertmanager/alertmanager.yml

global:
  smtp_smarthost: 'localhost:25'
  smtp_from: 'alertmanager@example.org'
  smtp_auth_username: 'alertmanager'
  smtp_auth_password: 'password'

route:
  group_by: ['cluster']
  receiver: team-a

receivers:
- name: 'team-a'
  email_configs:
  - to: 'team-a@example.org'
5. 启动服务
# docker-compose -f docker-compose.yml pull
# docker-compose -f docker-compose.yml up -d
grafana使用默认用户名密码 admin password 登陆
a | 查看服务安装情况
# docker-compse ps

# docker ps -a
6. 使用 curl 生成测试数据
- 可以使用$RANDOM来生成随机数
# while true; do
    echo "mymetric $RANDOM" | curl --data-binary @- http://localhost:9091/metrics/job/my-push-job
    sleep 1
done
"mymetric"就是这个被监控的指标,这个监控指标推送到pushgateway比较简洁直观的
- 在浏览器里打开pushgateway: "http://10.0.0.1:9091/"
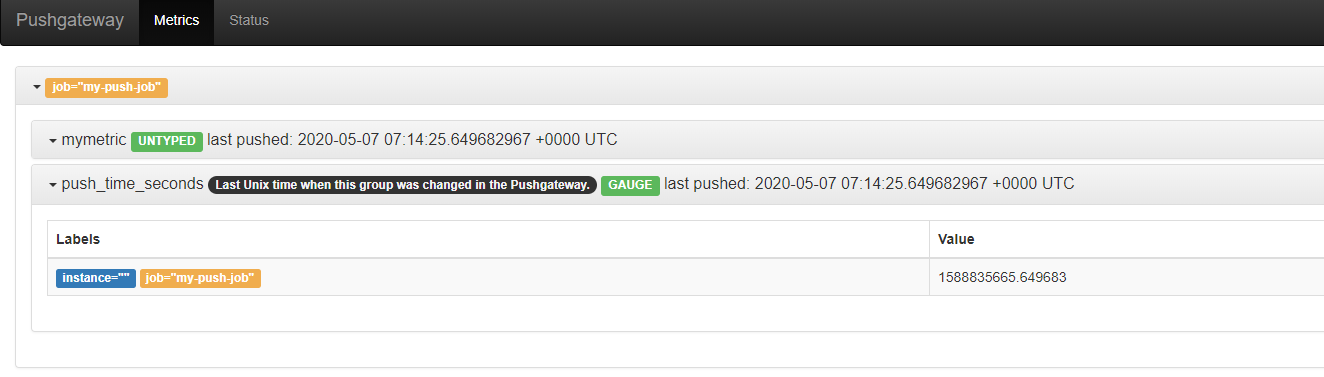
可以看到测试的数据已经进入pushgateway了
参考文档
https://juejin.im/post/5ce3e44bf265da1bd260c157