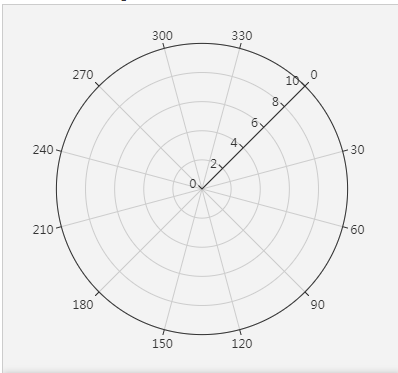
极坐标图
HTML:
<div id="eChart"></div>
css:
#eChart{
500px;
height:500px;
}
js:
/*渲染echart表格 */
function echart(redData, blueData, yellowData, clockwise, echartId) {
var myChart = echarts.init(document.getElementById(echartId));
var option = {
title: {
text: ''
},
polar: {
center: ['50%', '50%']
},
tooltip: {
trigger: 'axis',
axisPointer: {
type: 'cross'
}
},
angleAxis: {//极坐标系的角度轴
type: 'value',
startAngle: 90,
splitNumber: 30, //坐标轴分割段数
clockwise: clockwise, //是否逆时针
axisLine: { //坐标轴轴线设置
lineStyle: {
color: '#ccc',
}
},
axisTick: { //坐标轴刻度设置
show: false
},
splitLine: { //分割线设置
show: false,
},
axisLabel: { //刻度标签设置
textStyle: {
color: '#333'
}
}
},
radiusAxis: {//极坐标系的径向轴。
min: 0,
axisLine: { //坐标轴轴线设置
show: false,
// lineStyle: {
// color: "#ccc"
// }
},
axisTick: { //坐标轴刻度设置
show: false
},
axisLabel: { //刻度标签设置
margin: 0, //刻度与坐标轴之间的距离
textStyle: {
color: '#333'
}
}
},
series: [{
coordinateSystem: 'polar',
name: 'line',
type: 'line',
showSymbol: false,
smooth: true,
data: redData, //红线数据参数
lineStyle: {
normal: {
color: '#f00'
}
}
}, {
coordinateSystem: 'polar',
name: 'line',
type: 'line',
showSymbol: false,
smooth: true,
data: blueData, //蓝线数据参数
lineStyle: {
normal: {
color: '#0000ff'
}
}
}, {
coordinateSystem: 'polar',
name: 'line',
type: 'line',
showSymbol: false,
smooth: true,
data: yellowData, //黄线数据参数
lineStyle: {
normal: {
color: 'goldenrod'
}
}
}],
animationDuration: 2000
};
myChart.clear(); //清空数据缓存
myChart.setOption(option);
}//结束