Matplotlib 绘图线
绘图过程如果我们自定义线的样式,包括线的类型、颜色和大小等。
线的类型
线的类型可以使用 linestyle 参数来定义,简写为 ls。
| 类型 | 简写 | 说明 |
|---|---|---|
| 'solid' (默认) | '-' | 实线 |
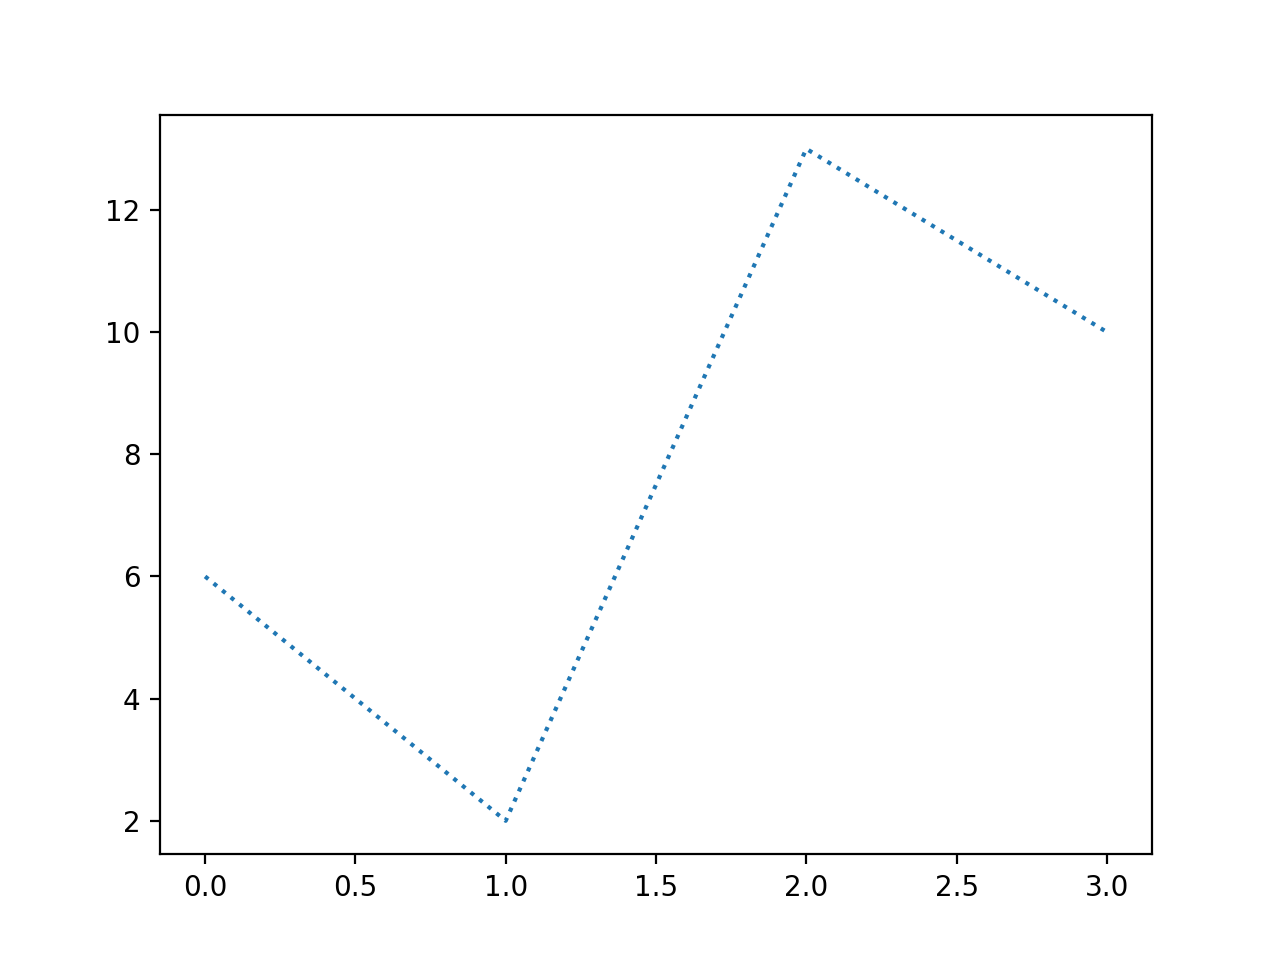
| 'dotted' | ':' | 点虚线 |
| 'dashed' | '--' | 破折线 |
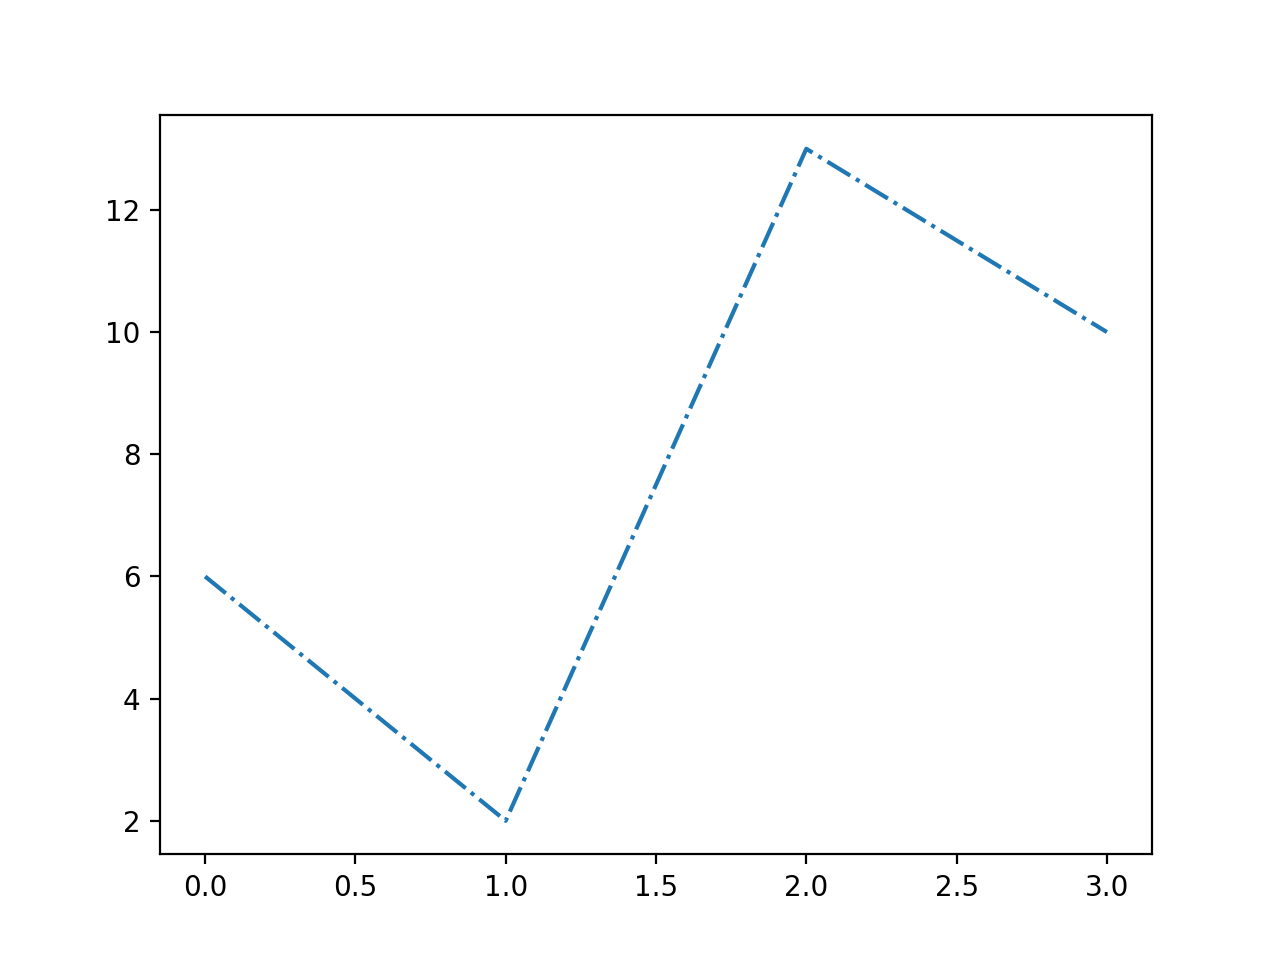
| 'dashdot' | '-.' | 点划线 |
| 'None' | '' 或 ' ' | 不画线 |
实例
import matplotlib.pyplot as plt
import numpy as np

ypoints = np.array([6, 2, 13, 10])

plt.plot(ypoints, linestyle = 'dotted')
plt.show()
显示结果如下:
使用简写:
实例
import matplotlib.pyplot as plt
import numpy as np

ypoints = np.array([6, 2, 13, 10])

plt.plot(ypoints, ls = '-.')
plt.show()
显示结果如下:
线的颜色
线的颜色可以使用 color 参数来定义,简写为 c。
颜色类型:
| 颜色标记 | 描述 | |
|---|---|---|
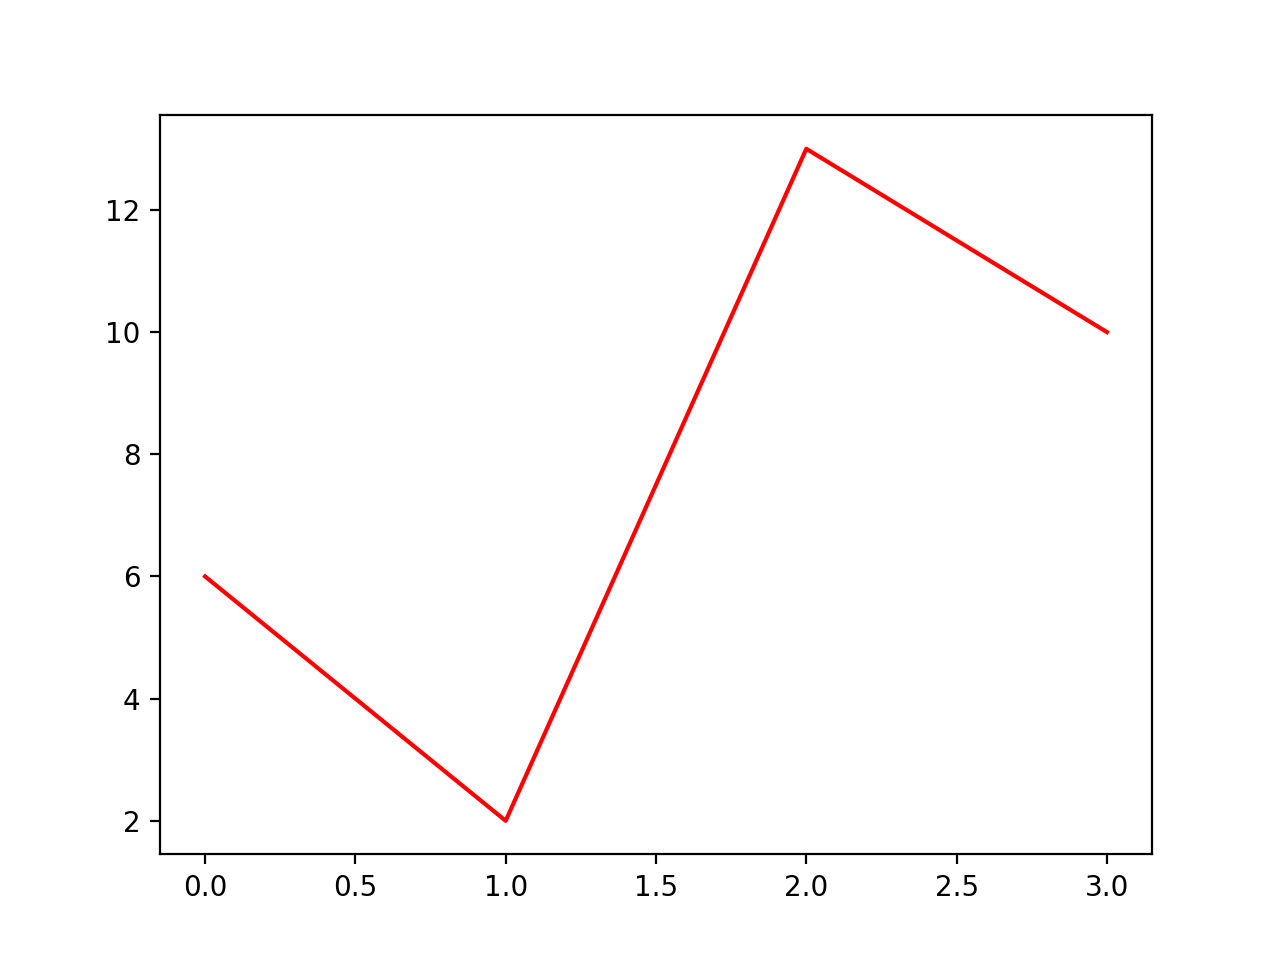
| 'r' | 红色 | |
| 'g' | 绿色 | |
| 'b' | 蓝色 | |
| 'c' | 青色 | |
| 'm' | 品红 | |
| 'y' | 黄色 | |
| 'k' | 黑色 | |
| 'w' | 白色 | |
当然也可以自定义颜色类型,例如:SeaGreen、#8FBC8F 等,完整样式可以参考 HTML 颜色值。
实例
import matplotlib.pyplot as plt
import numpy as np

ypoints = np.array([6, 2, 13, 10])

plt.plot(ypoints, color = 'r')
plt.show()
显示结果如下:
实例
import matplotlib.pyplot as plt
import numpy as np

ypoints = np.array([6, 2, 13, 10])

plt.plot(ypoints, c = '#8FBC8F')
plt.show()
显示结果如下:
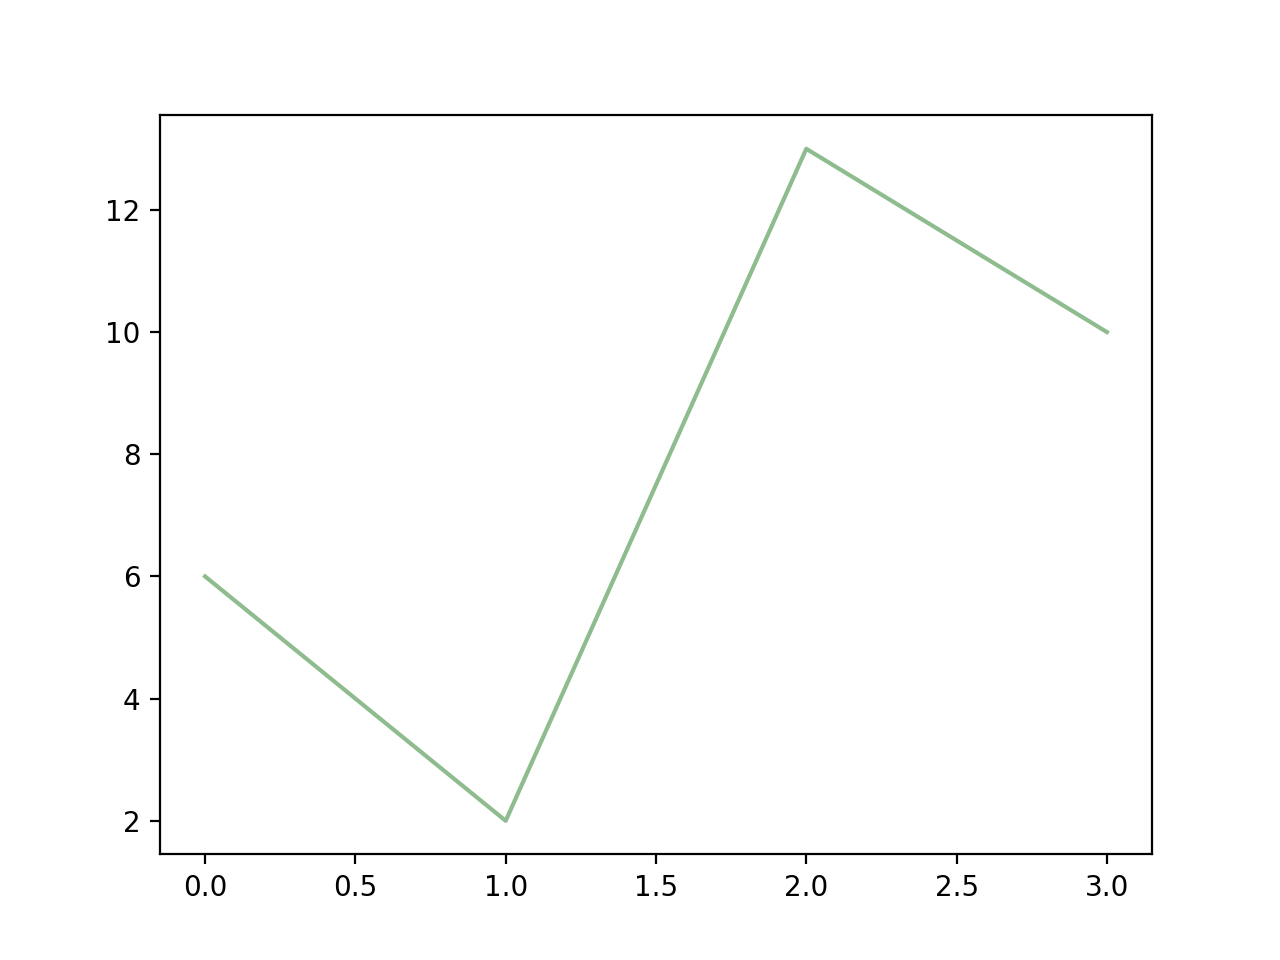
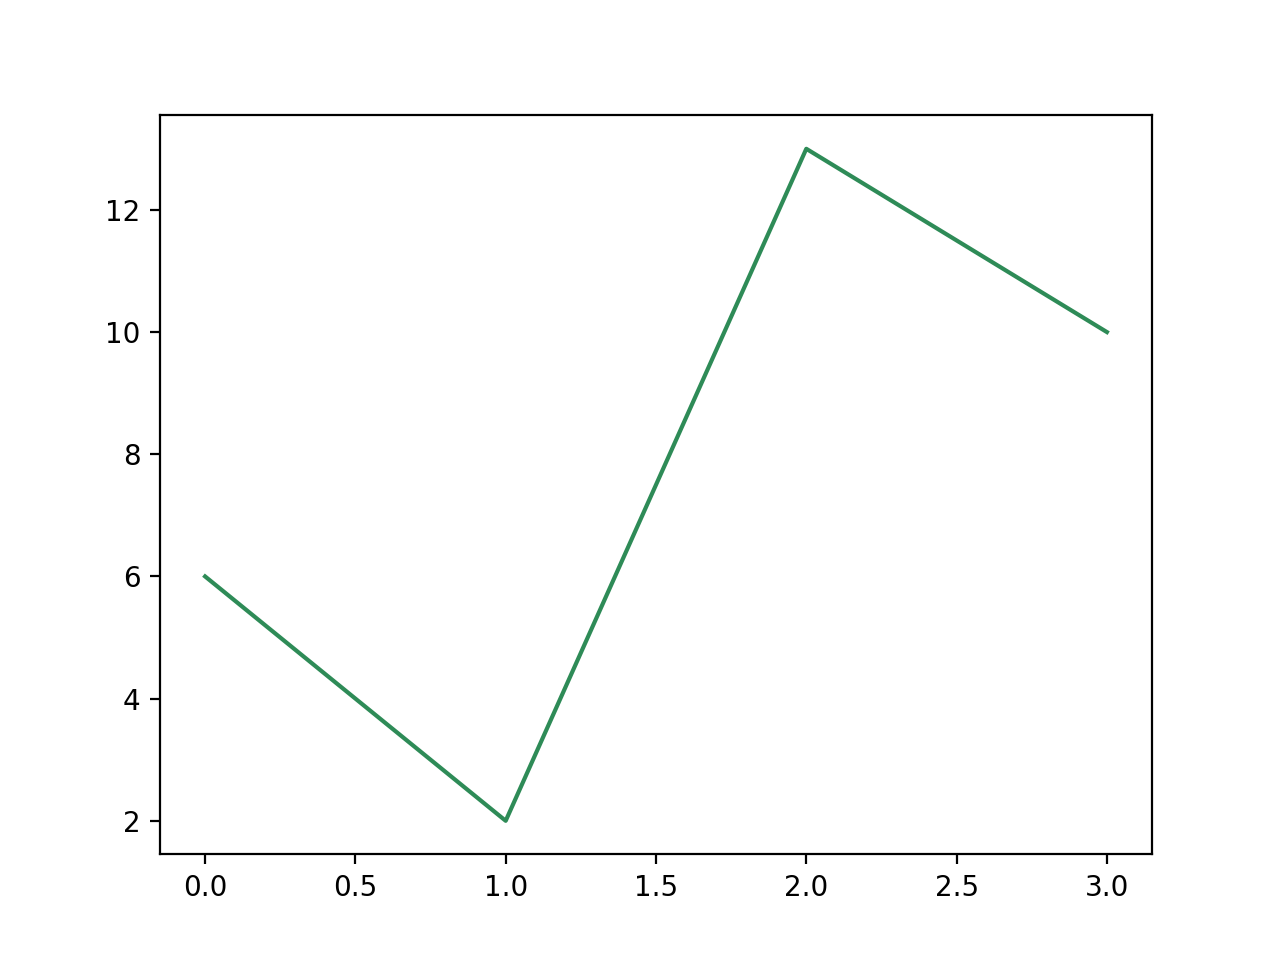
实例
import matplotlib.pyplot as plt
import numpy as np

ypoints = np.array([6, 2, 13, 10])

plt.plot(ypoints, c = 'SeaGreen')
plt.show()
显示结果如下:
线的宽度
线的宽度可以使用 linewidth 参数来定义,简写为 lw,值可以是浮点数,如:1、2.0、5.67 等。
实例
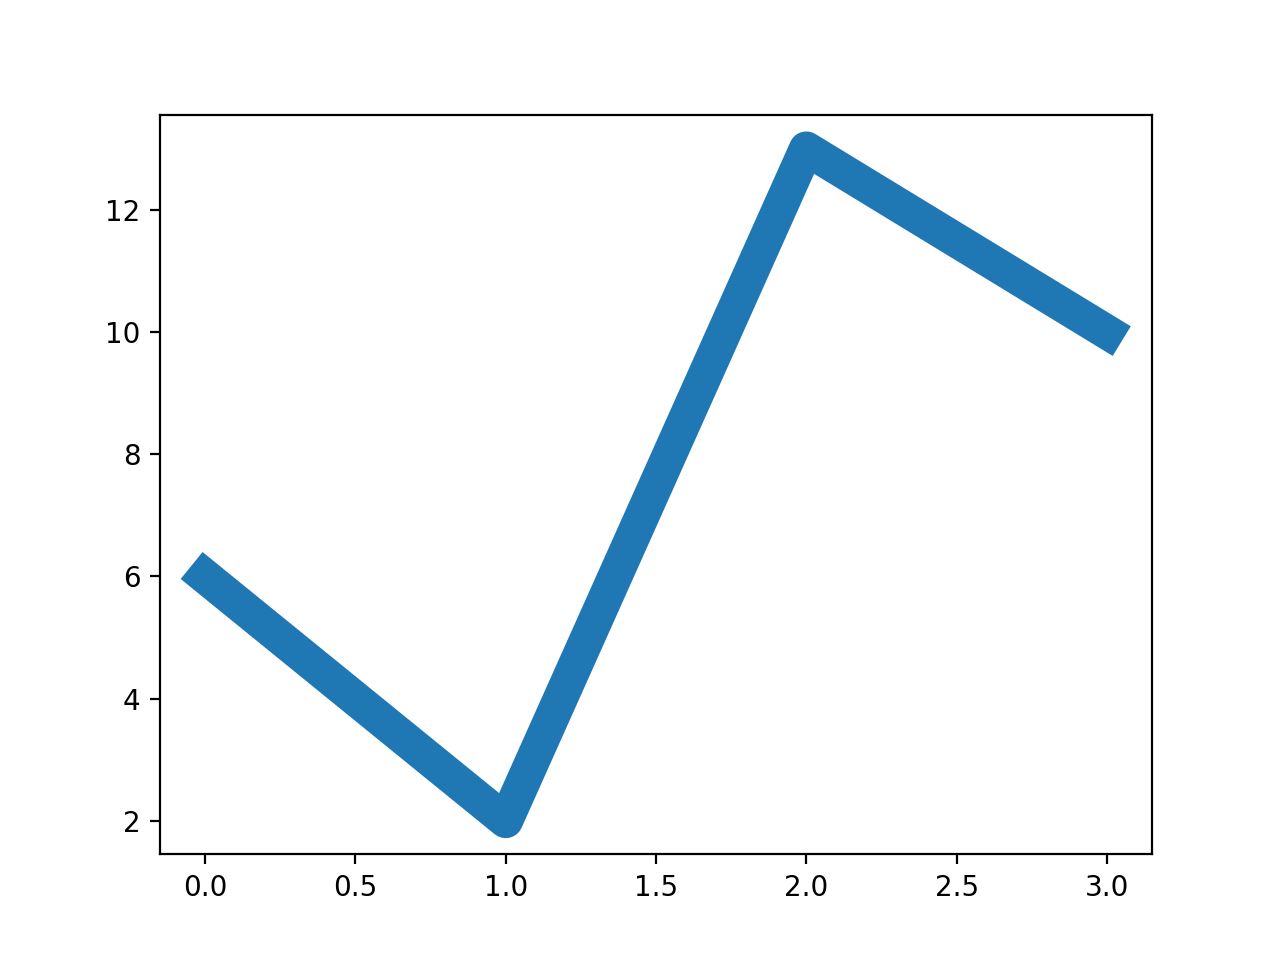
import matplotlib.pyplot as plt
import numpy as np

ypoints = np.array([6, 2, 13, 10])

plt.plot(ypoints, linewidth = '12.5')
plt.show()
显示结果如下:
多条线
plot() 方法中可以包含多对 x,y 值来绘制多条线。
实例
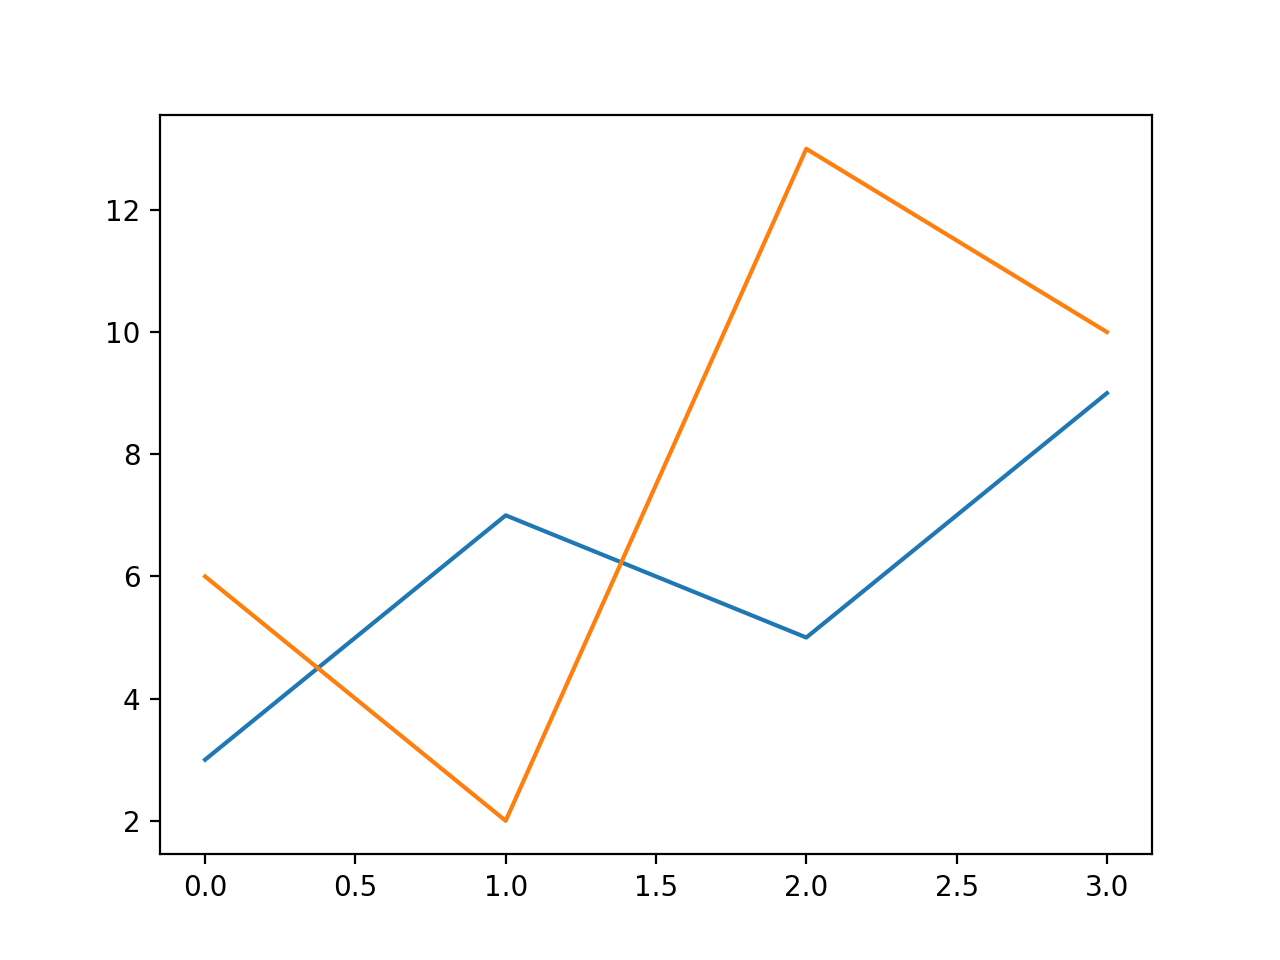
import matplotlib.pyplot as plt
import numpy as np

y1 = np.array([3, 7, 5, 9])
y2 = np.array([6, 2, 13, 10])

plt.plot(y1)
plt.plot(y2)

plt.show()
从上图可以看出 x 的值默认设置为 [0, 1, 2, 3]。
显示结果如下:
我们也可以自己设置 x 坐标等值:
实例
import matplotlib.pyplot as plt
import numpy as np

x1 = np.array([0, 1, 2, 3])
y1 = np.array([3, 7, 5, 9])
x2 = np.array([0, 1, 2, 3])
y2 = np.array([6, 2, 13, 10])

plt.plot(x1, y1, x2, y2)
plt.show()
显示结果如下:

REF
https://www.runoob.com/matplotlib/matplotlib-line.html