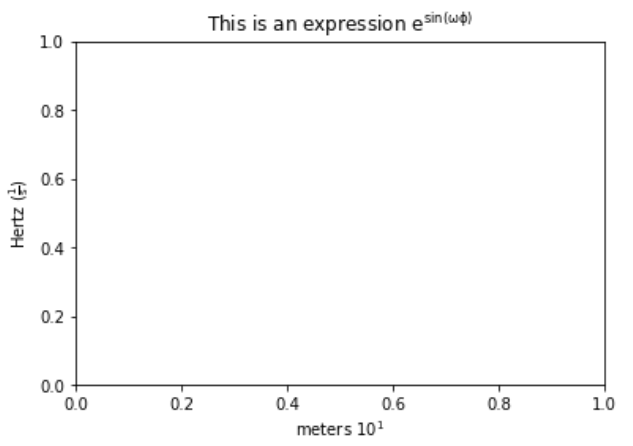
import matplotlib.pyplot as plt

fig, ax = plt.subplots()
ax.set(title=r'This is an expression $e^{sin(omegaphi)}$',
       xlabel='meters $10^1$', ylabel=r'Hertz $(frac{1}{s})$')
plt.show()
import matplotlib.pyplot as plt
import numpy as np
from scipy.optimize import curve_fit
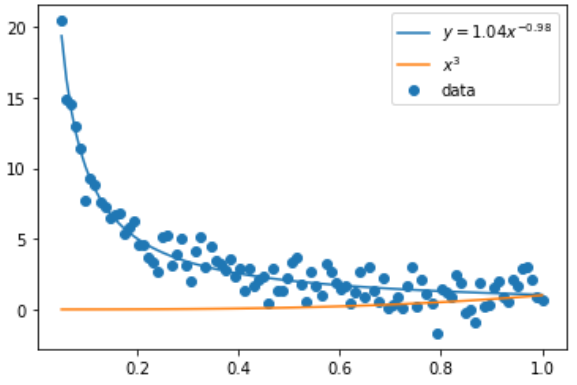
x_data = np.linspace(0.05,1,101)
y_data = 1/x_data
noise = np.random.normal(0, 1, y_data.shape)
y_data2 = y_data + noise
def func_power(x, a, b):
return a*x**b
popt, pcov= curve_fit(func_power, x_data, y_data2)
plt.figure()
plt.scatter(x_data, y_data2, label = 'data')
plt.plot(x_data, popt[0] * x_data ** popt[1], label = ("$y = {{{}}}x^{{{}}}$").format(round(popt[0],2), round(popt[1],2)))
plt.plot(x_data, x_data**3, label = '$x^3$')
plt.legend()
plt.show()
import matplotlib.pyplot as plt
import numpy as np
from scipy.optimize import curve_fit

x_data = np.linspace(0.05,1,101)
y_data = 1/x_data
noise = np.random.normal(0, 1, y_data.shape)
y_data2 = y_data + noise

def func_power(x, a, b):
    return a*x**b

popt, pcov= curve_fit(func_power, x_data, y_data2)

plt.figure(figsize=(4, 3))
plt.title('Losses')
plt.ylabel('Loss')
plt.xlabel('Epoch')
plt.scatter(x_data, y_data2, label = 'data')
plt.plot(x_data, popt[0] * x_data ** popt[1], label = ("$y = {{{}}}x^{{{}}}$").format(round(popt[0],2), round(popt[1],2)))
plt.plot(x_data, x_data**3, label = '$x^3$')
plt.legend()
plt.show()
REF
https://stackoverflow.com/questions/53781815/superscript-format-in-matplotlib-plot-legend
https://stackoverflow.com/questions/21226868/superscript-in-python-plots