https://www.cs.cmu.edu/~epxing/Class/10708-17/slides/lecture1-Introduction.pdf
Computational and CS orientated => DK and NF's book
Statistical and easier one => Jordan's book
MLAPP => also a good book
HWs => Theory, algorithm design and implementation. Very heavy.

N copies of data.
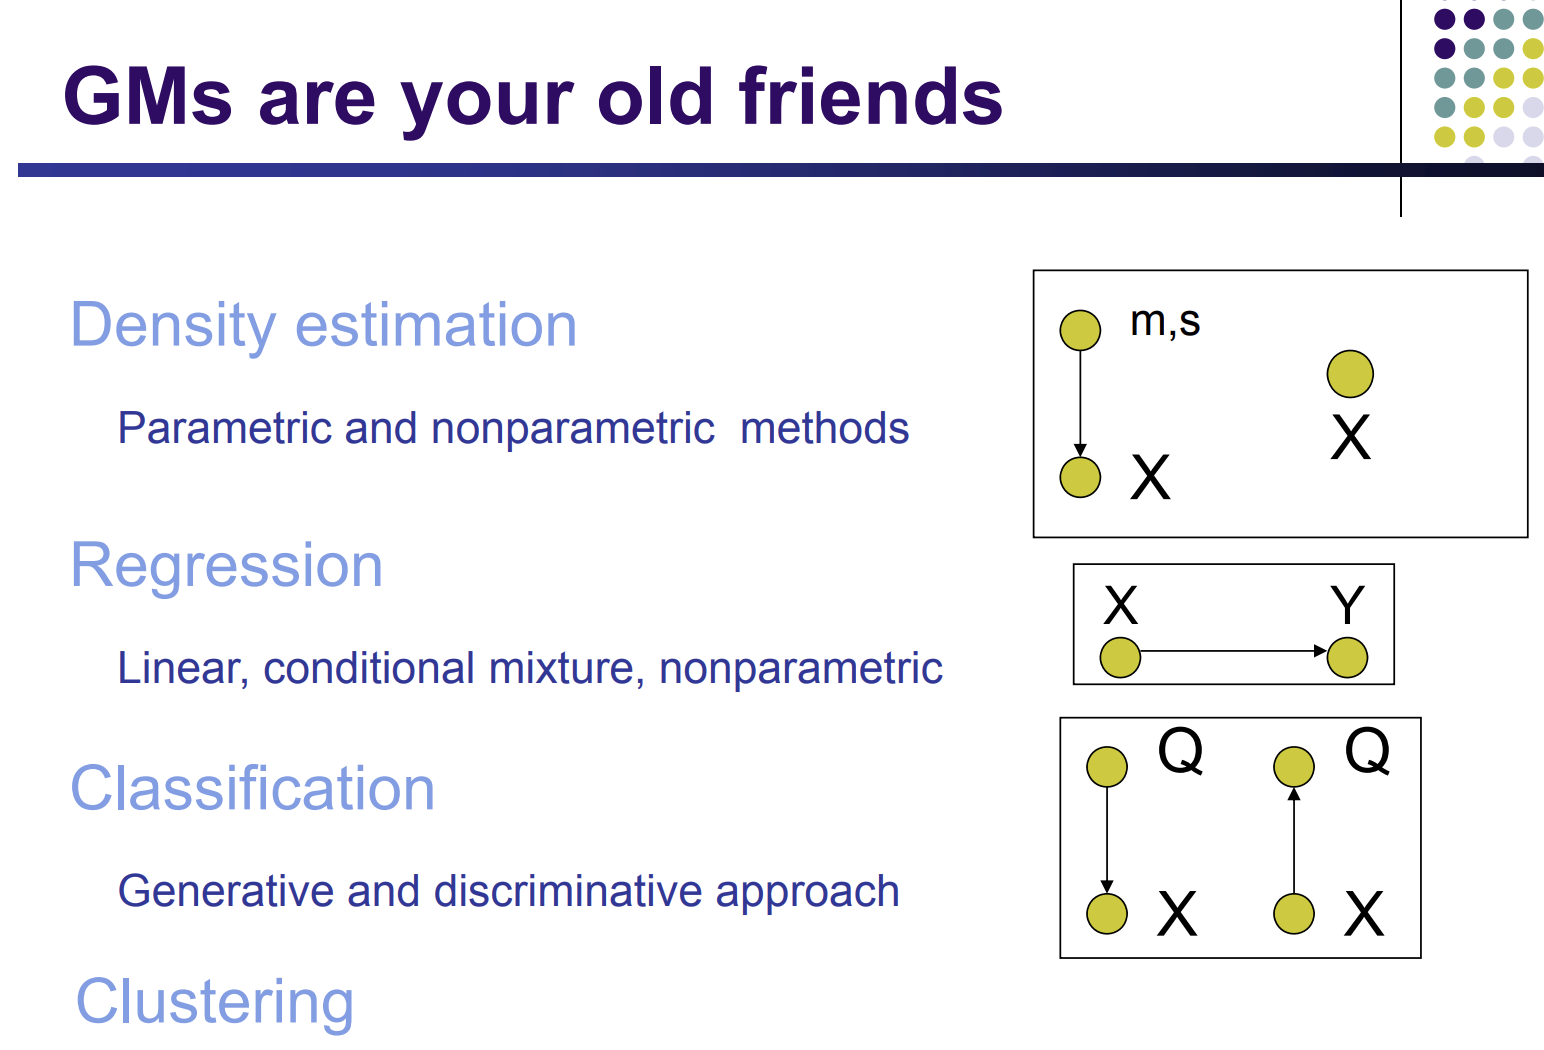
subscript means the dims of features.
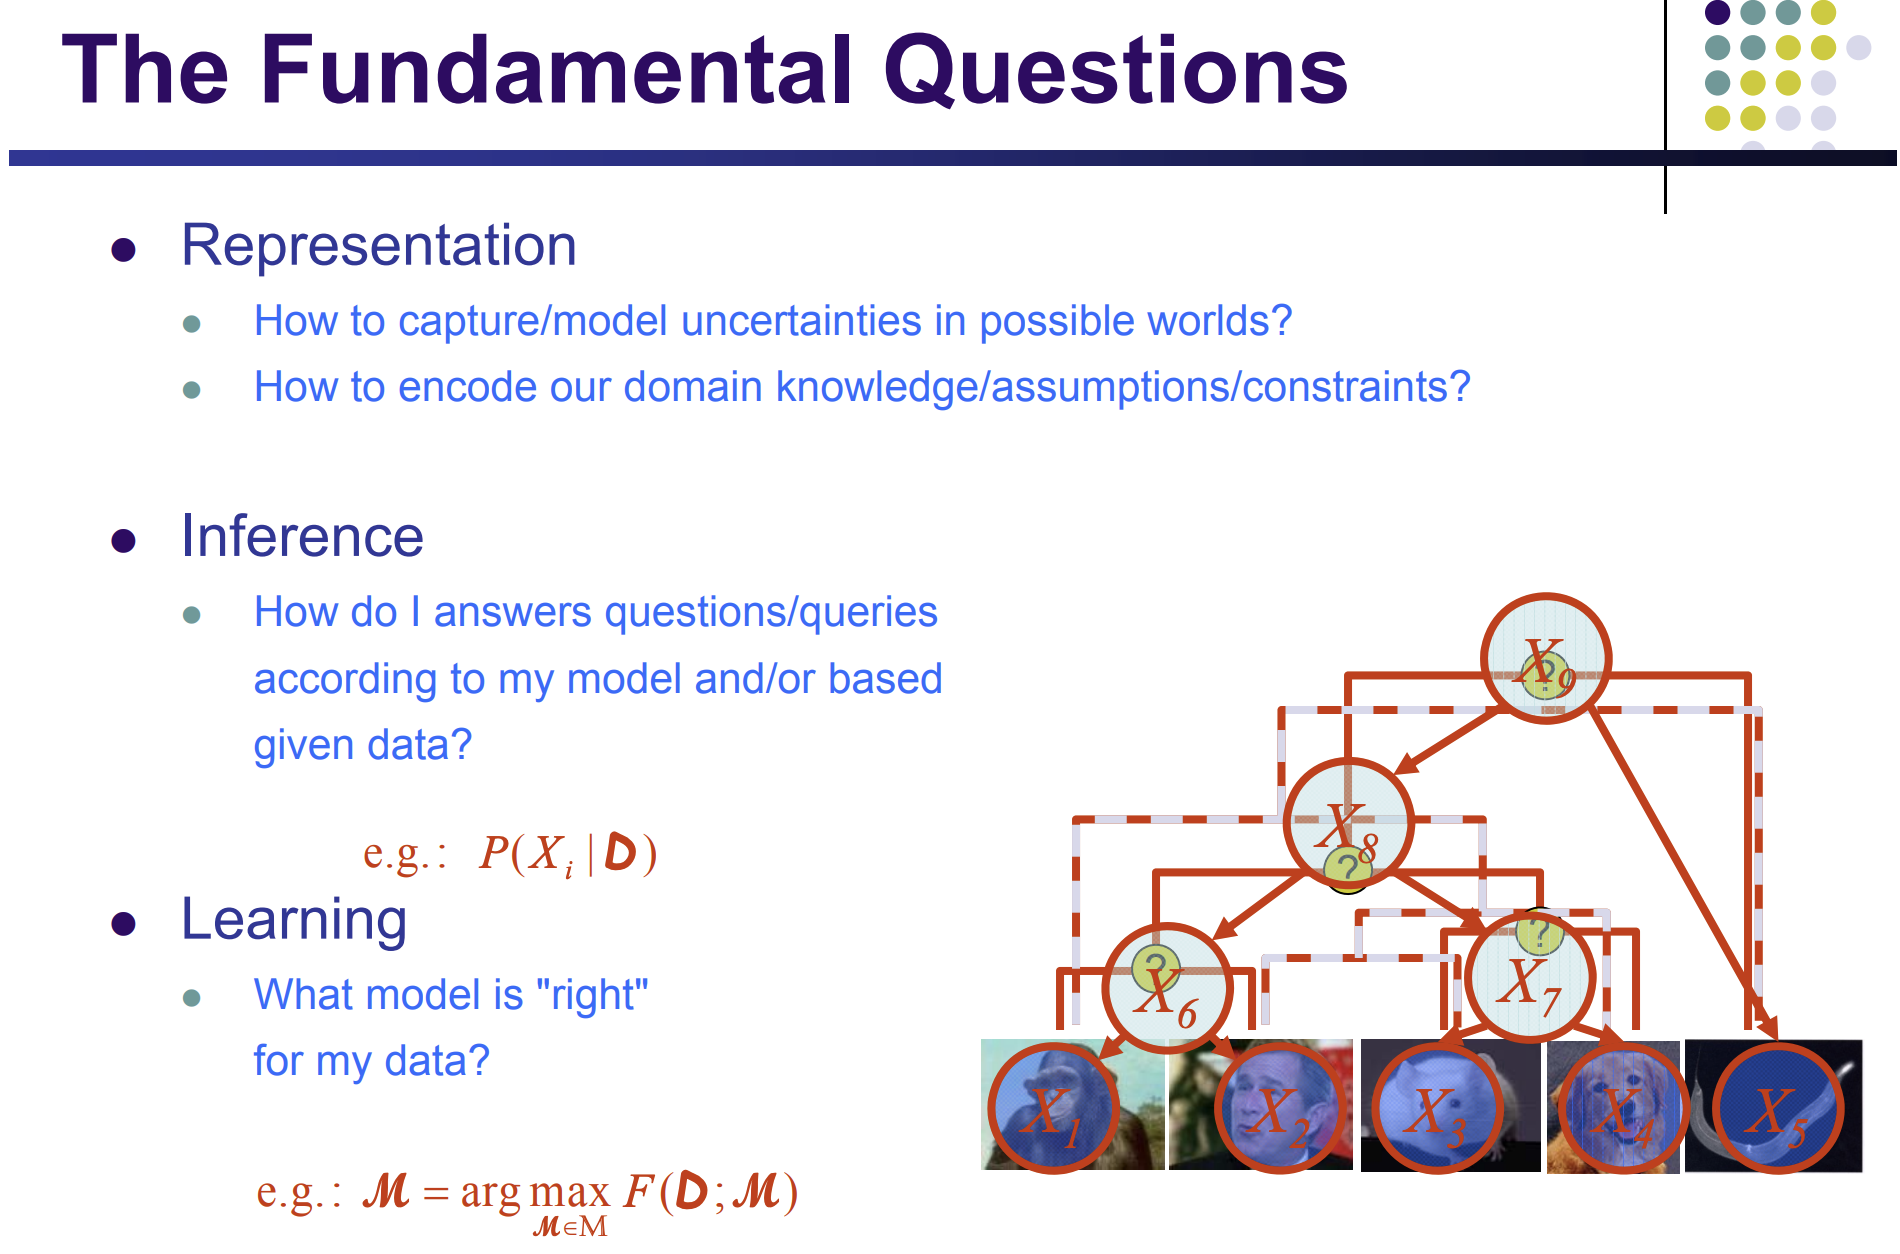
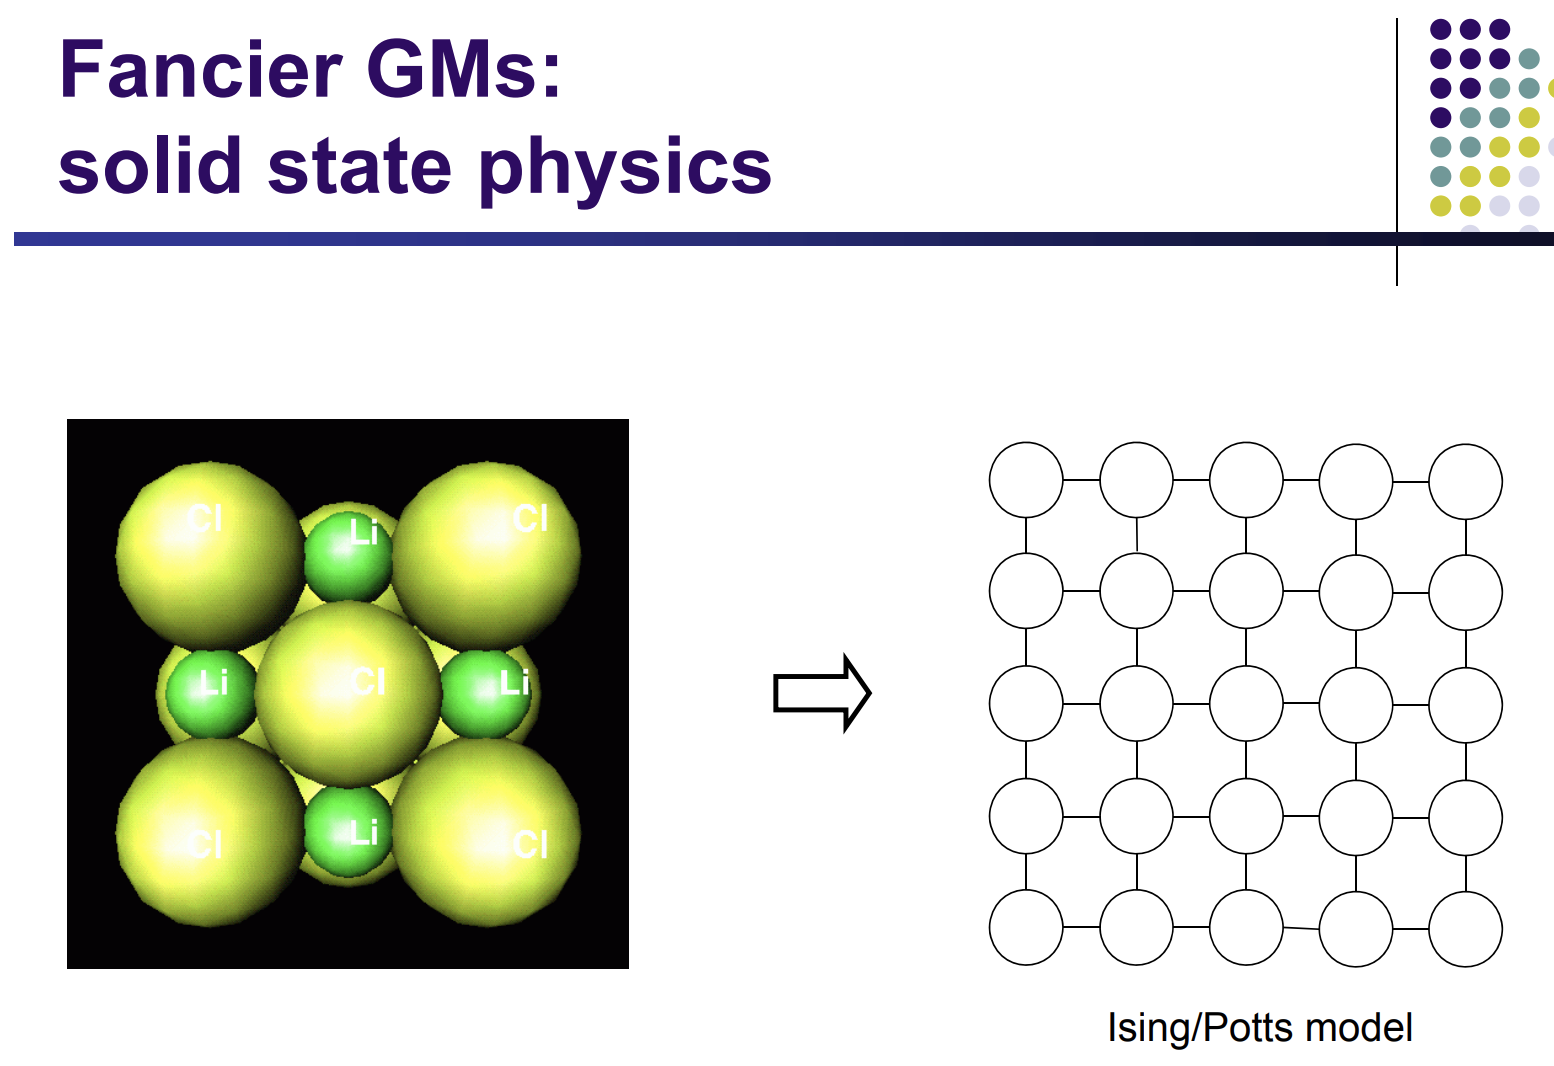
 bottom right figures
a given presentation + inference => enough for some tasks
learn a representation => a more adv. task
M* = argmax (m in M) F(D;m)
M*: best representation
m: one representation
F: score function
D: data

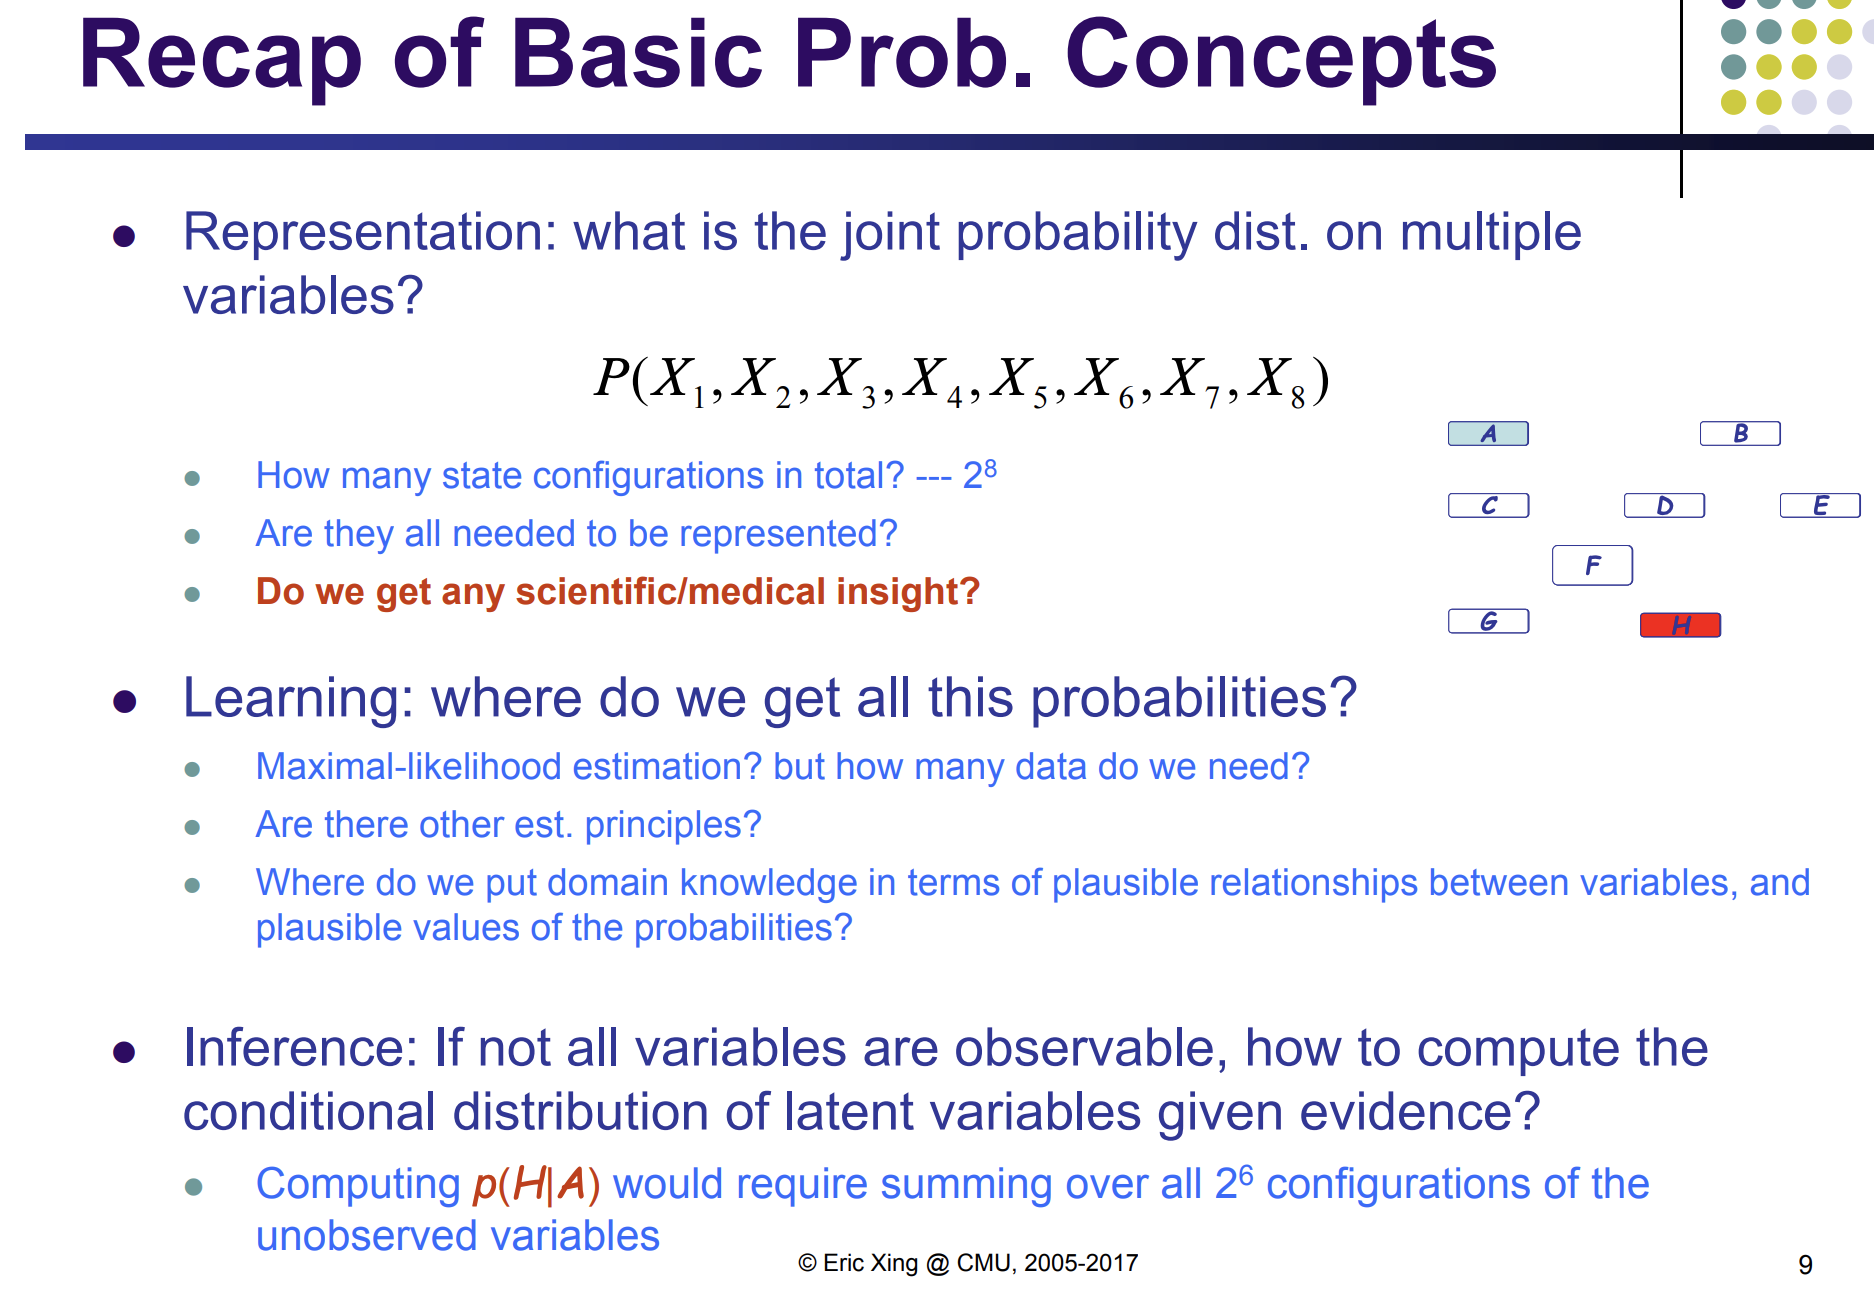
one simple case: every random variable X_n is binary: X_n in {0,1}

O(exp(n)) => bad algorithm

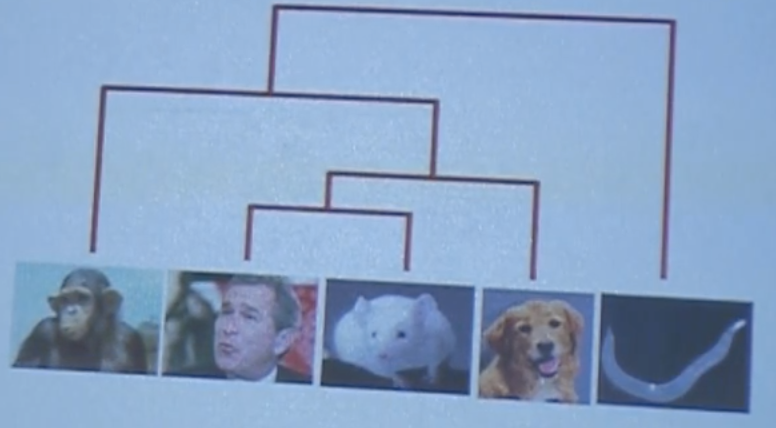
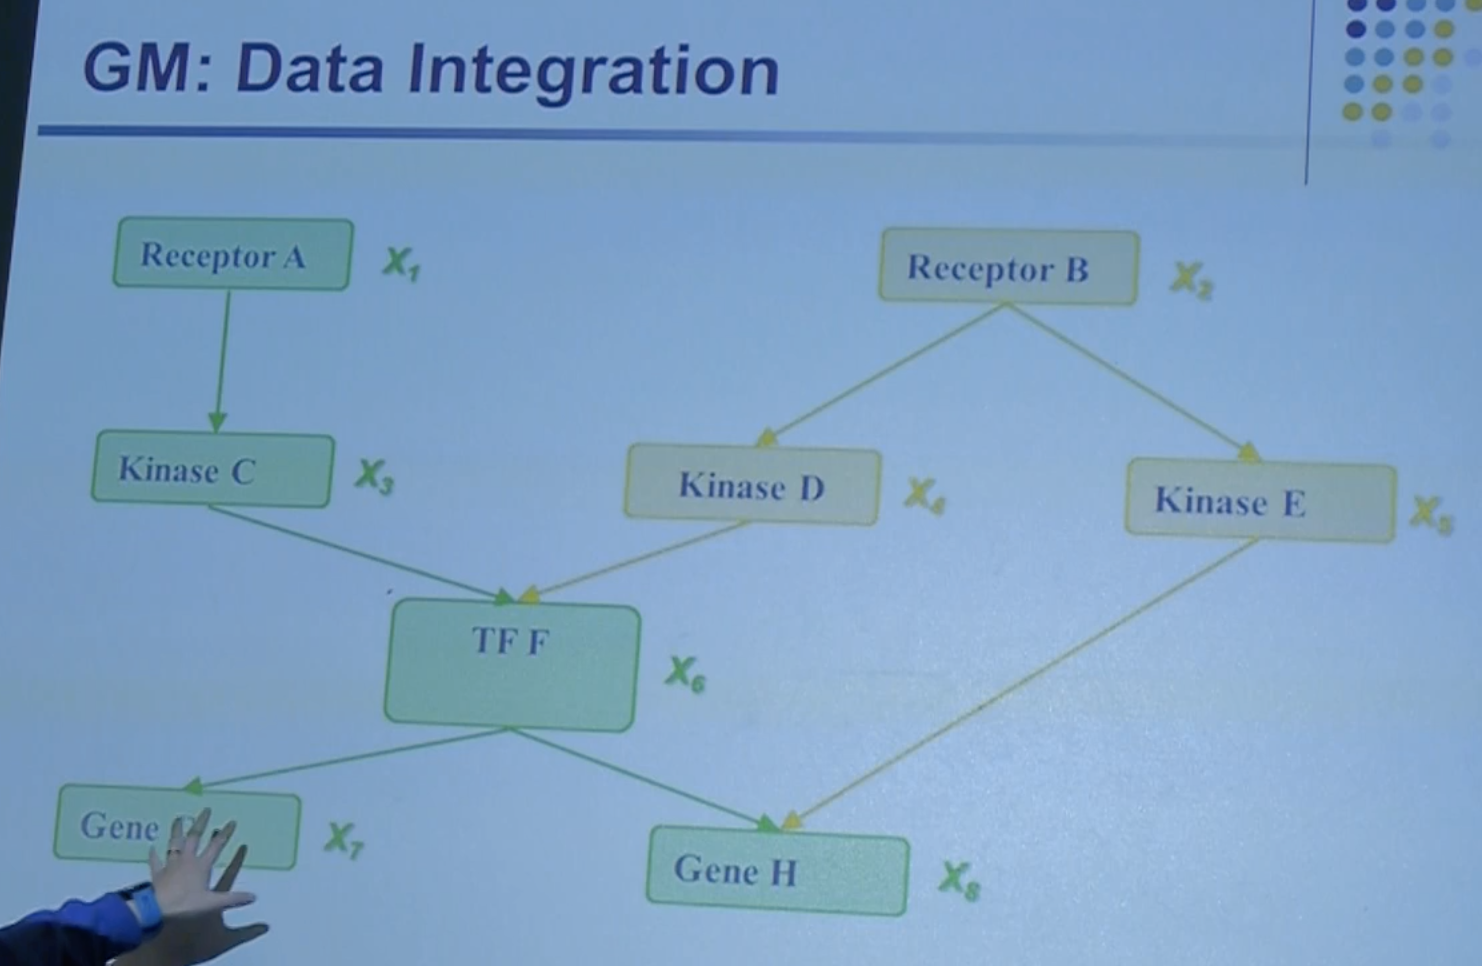
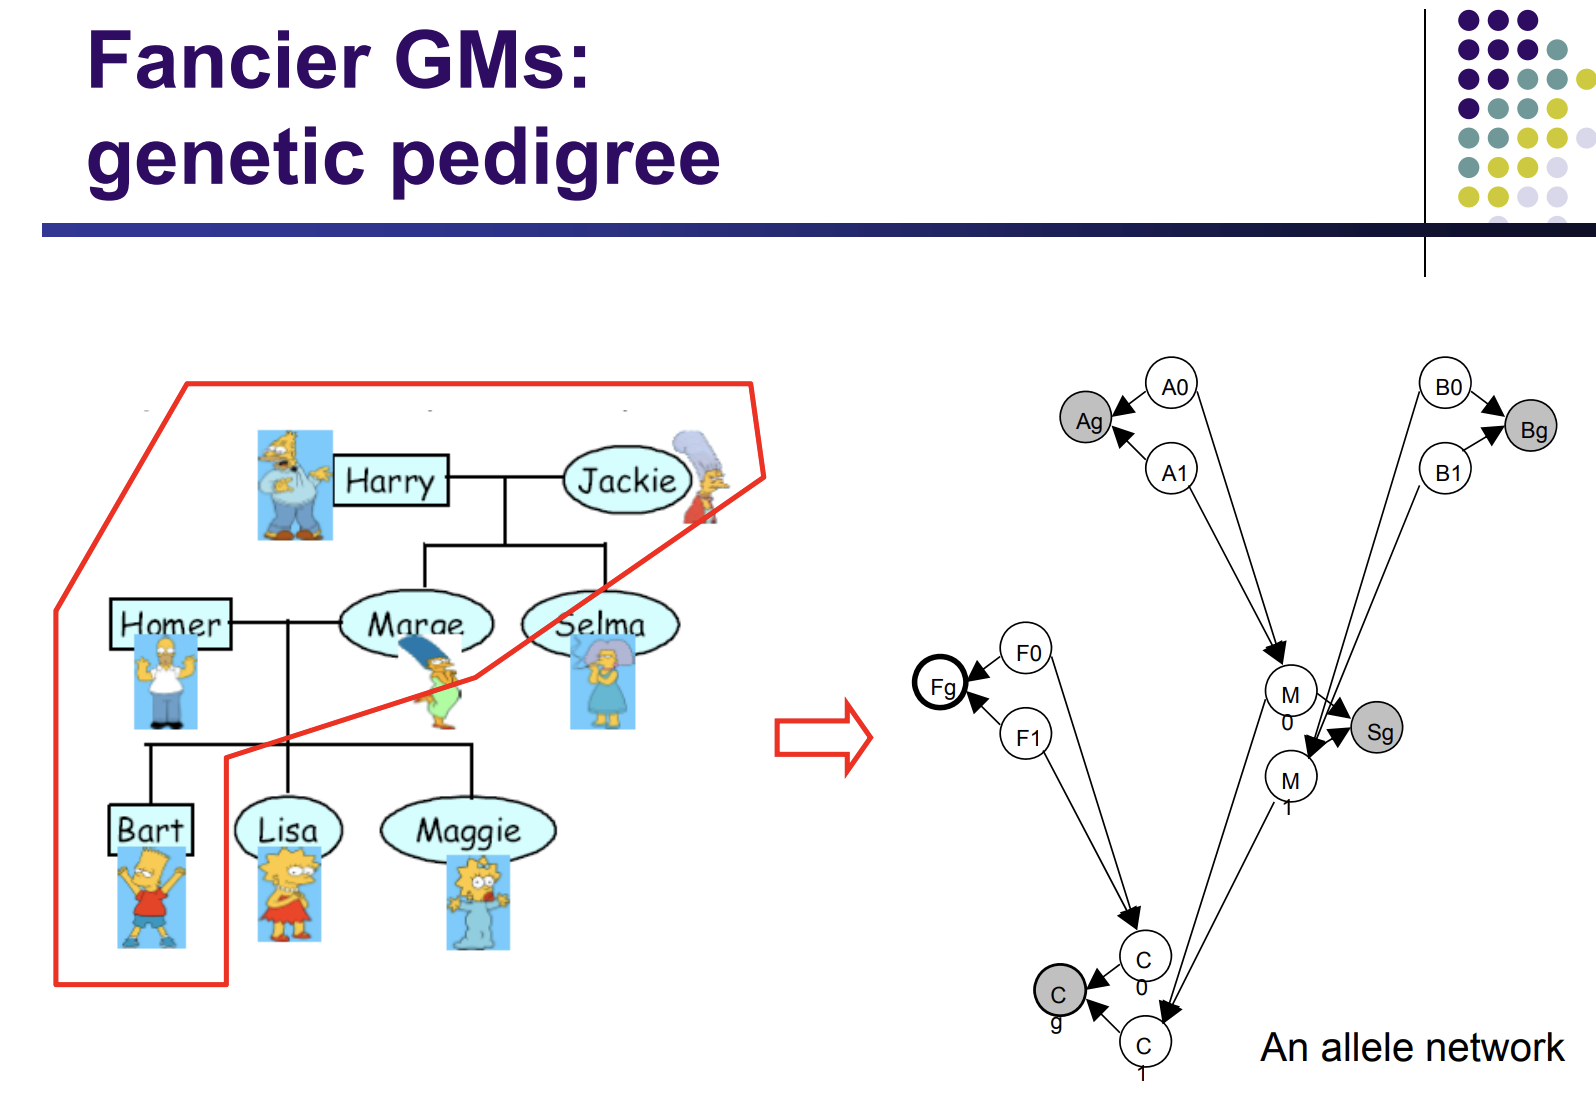
↓↓↓↓↓↓↓↓↓↓(invite a biologist)↓↓↓↓↓↓↓↓↓↓↓
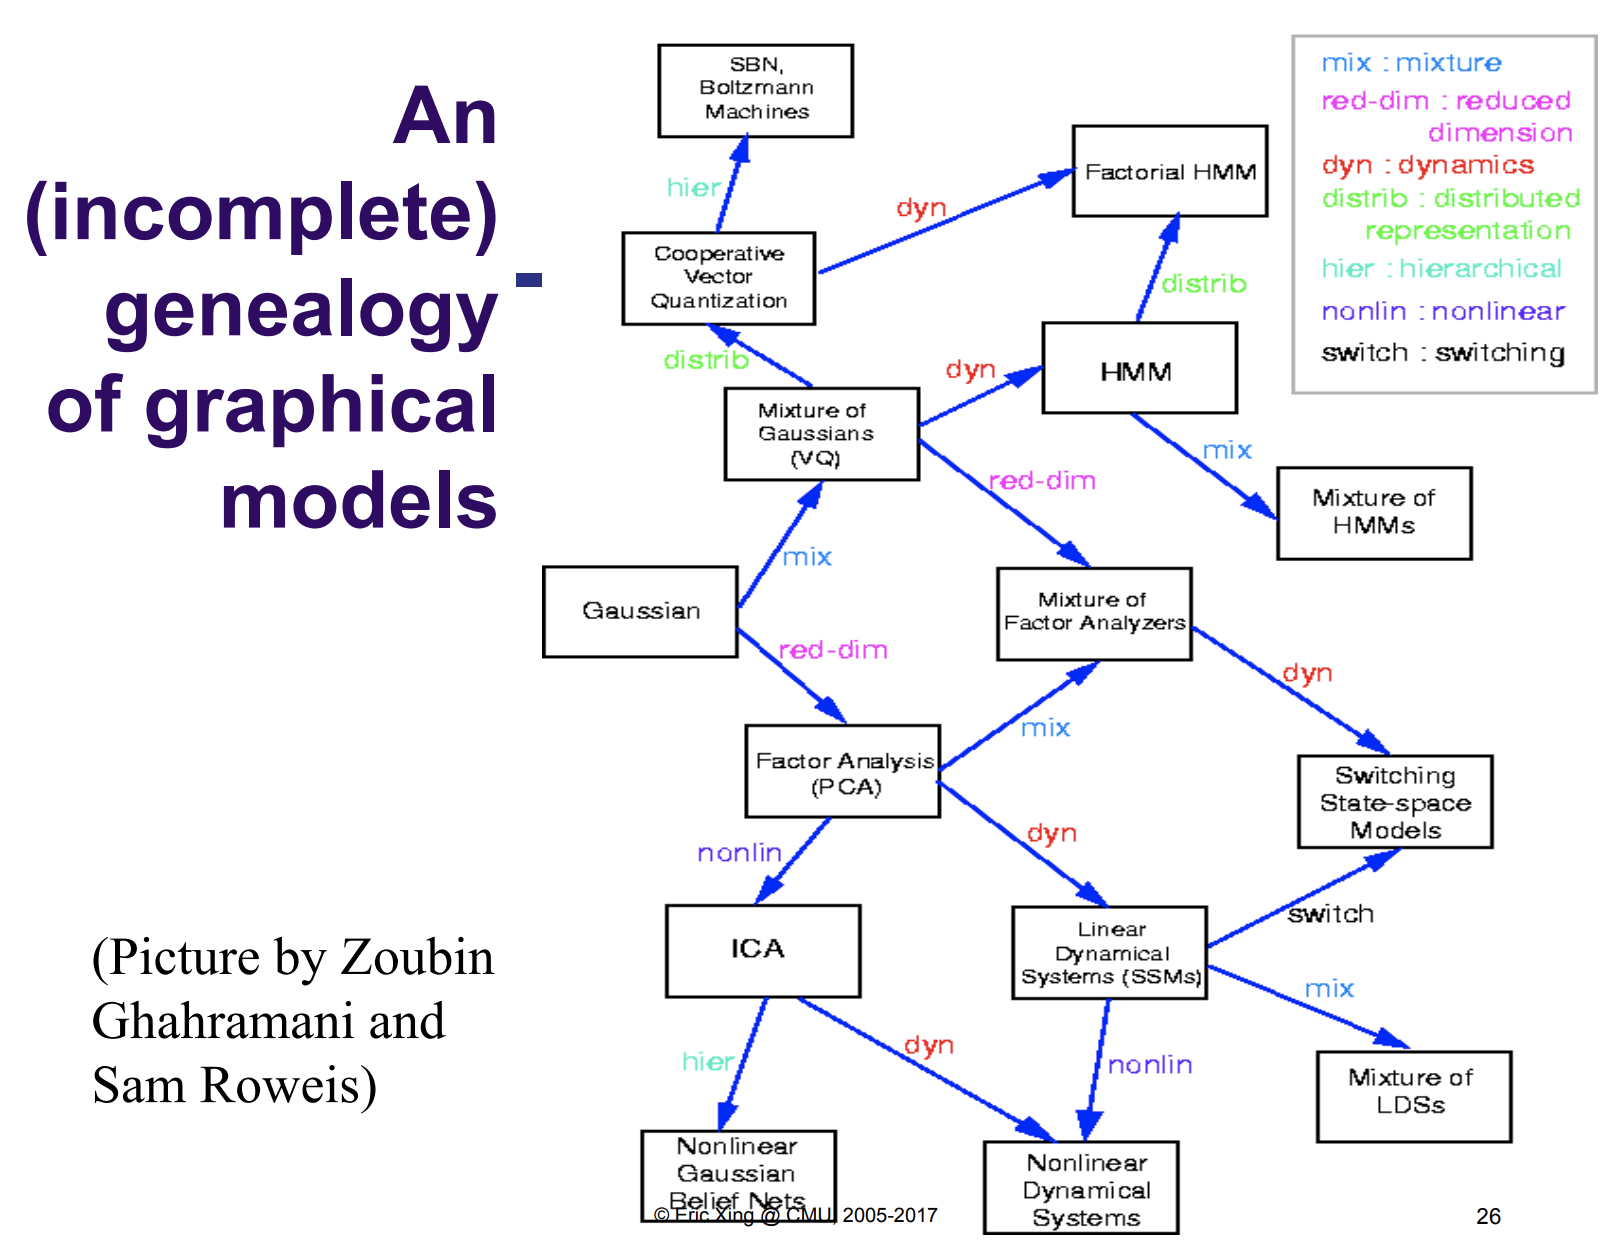
categorize
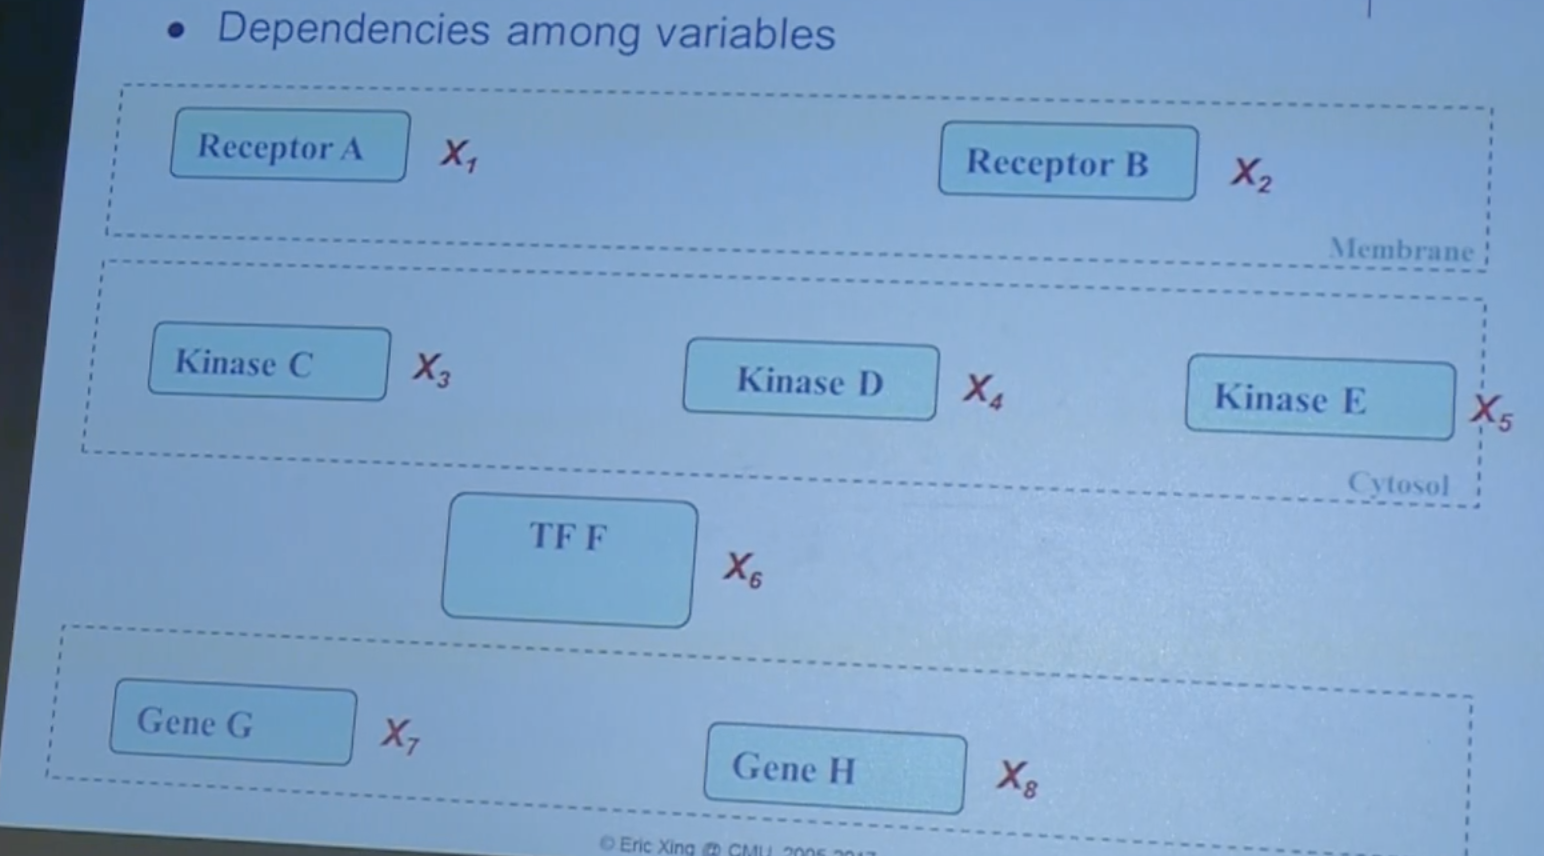
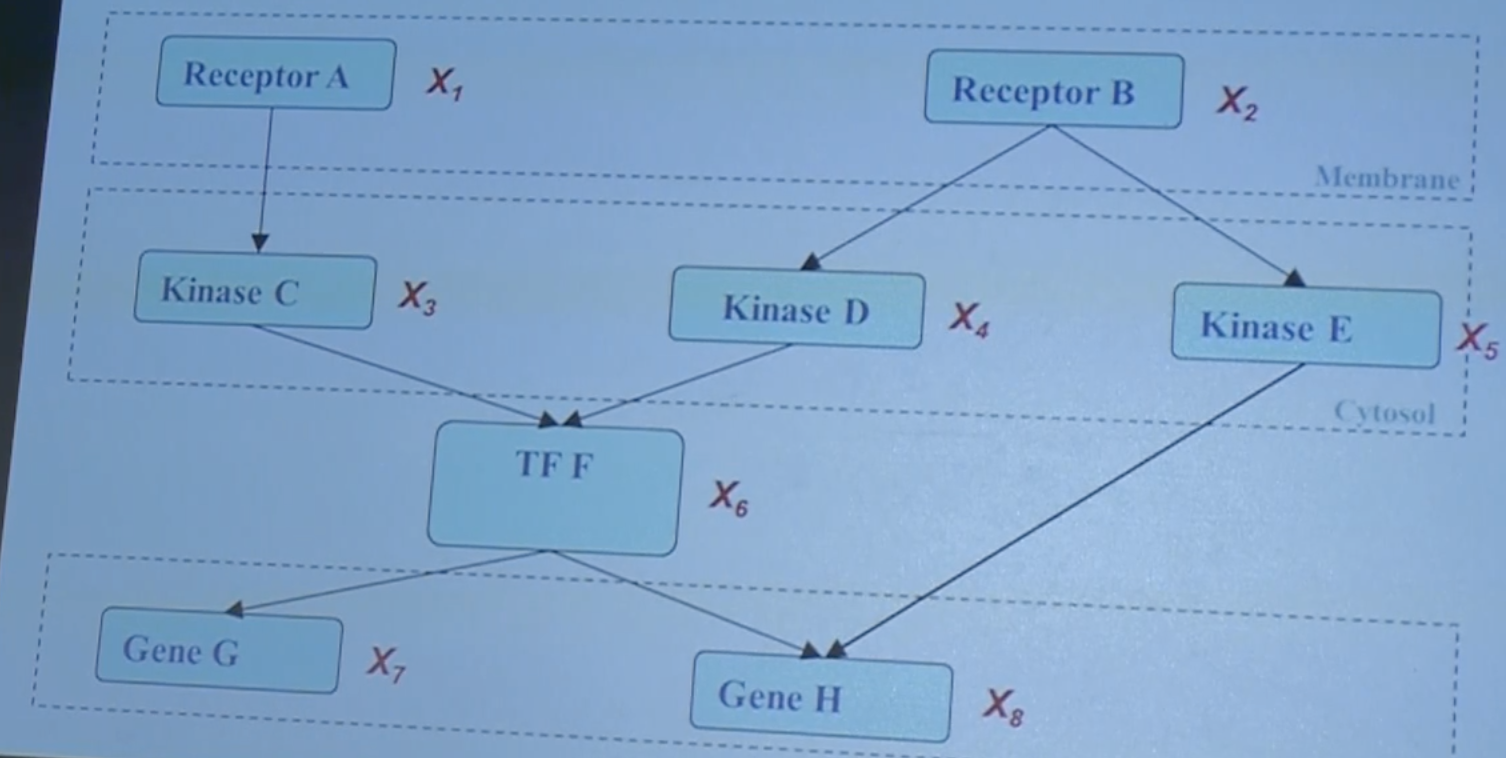
add pathways
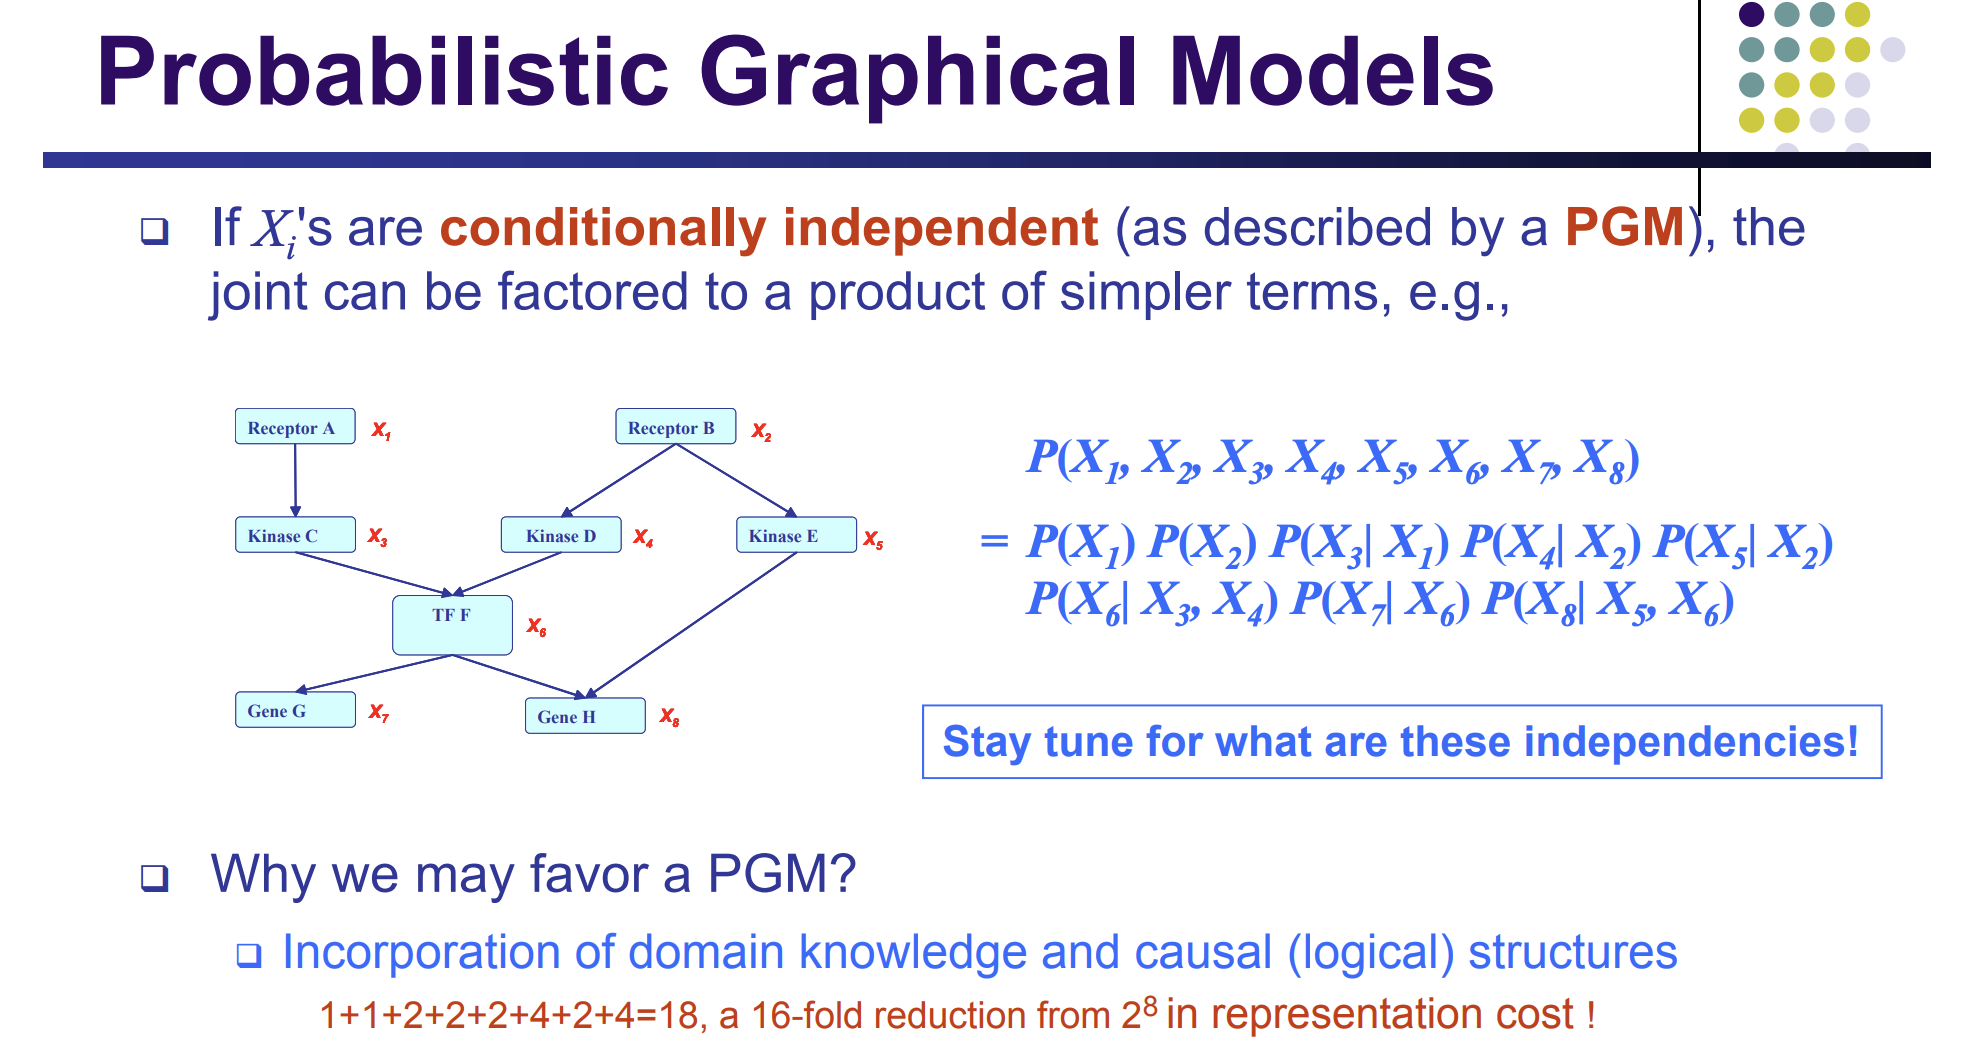
18 vs 2^8

A factorization rule. two resources of variables.
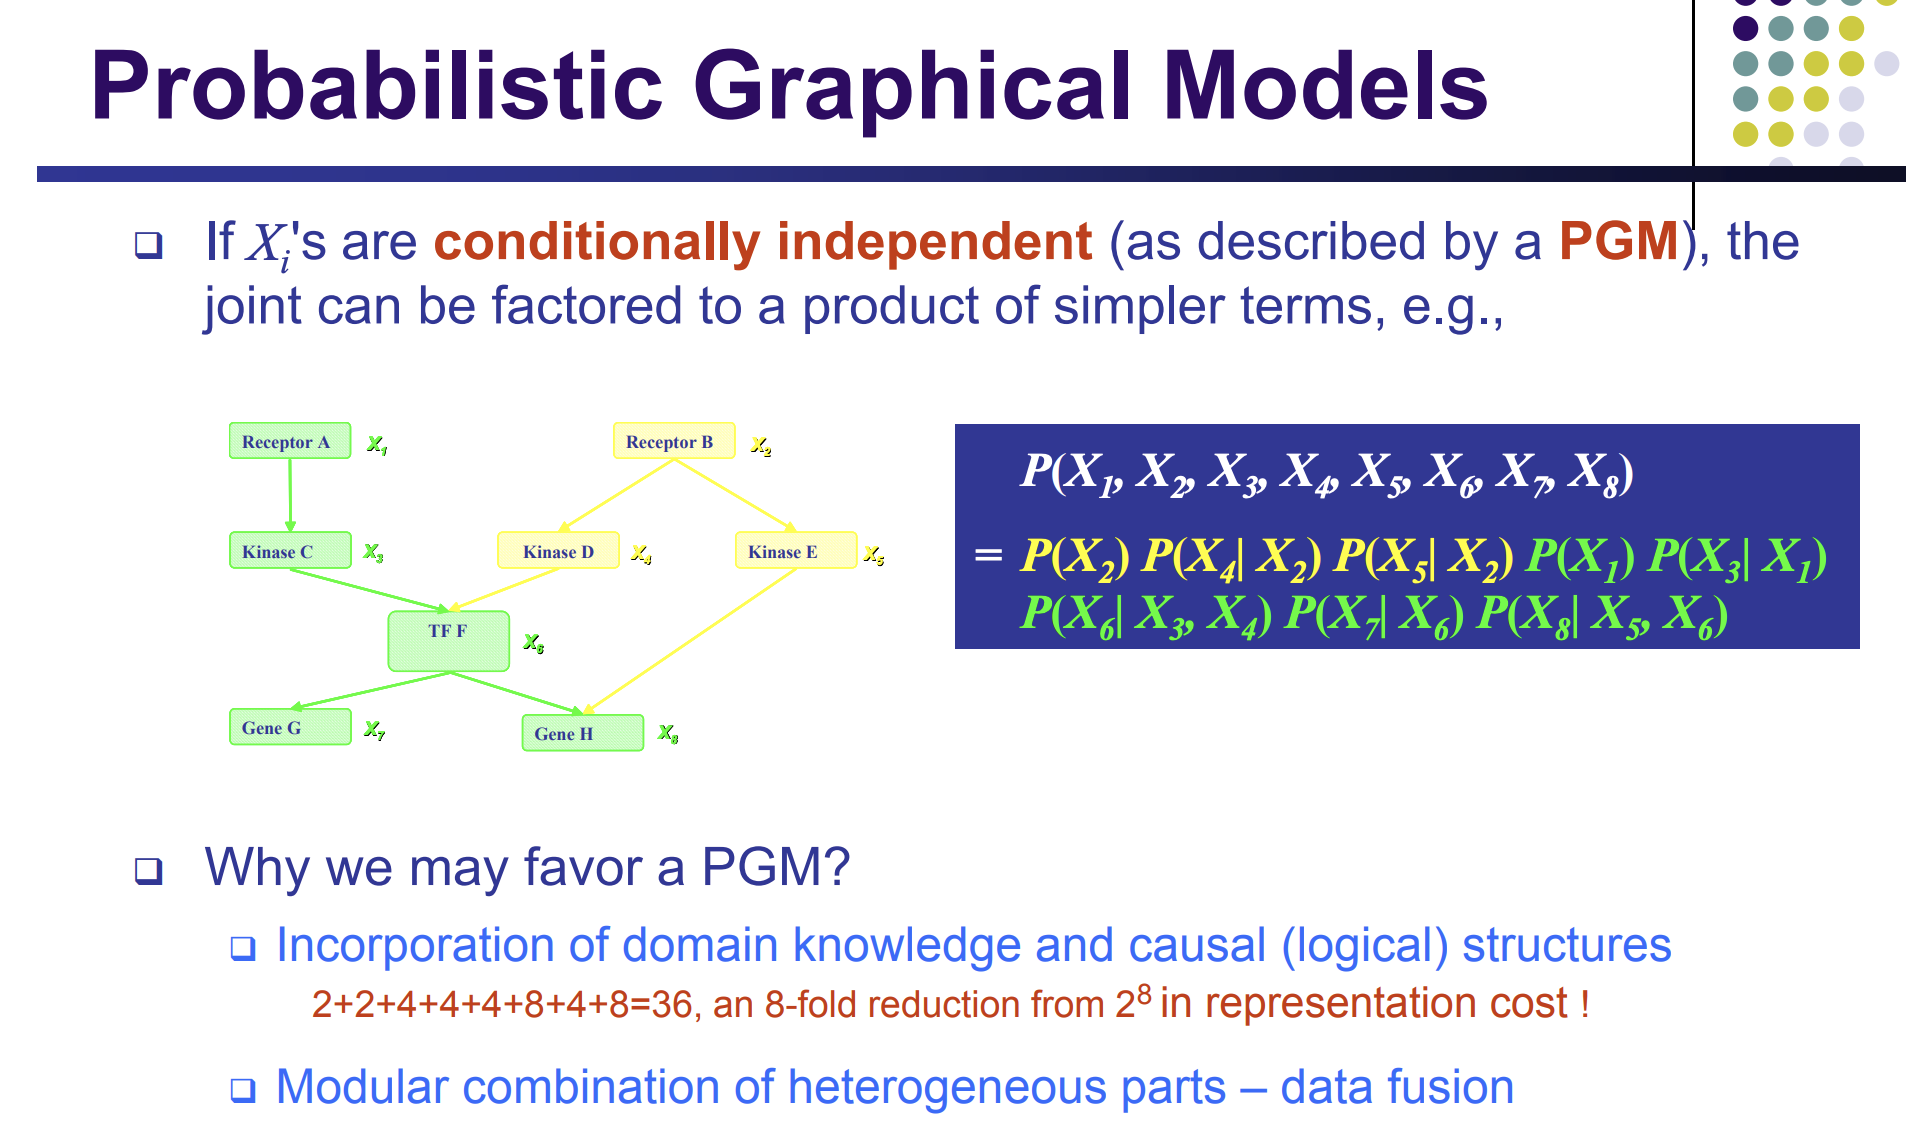


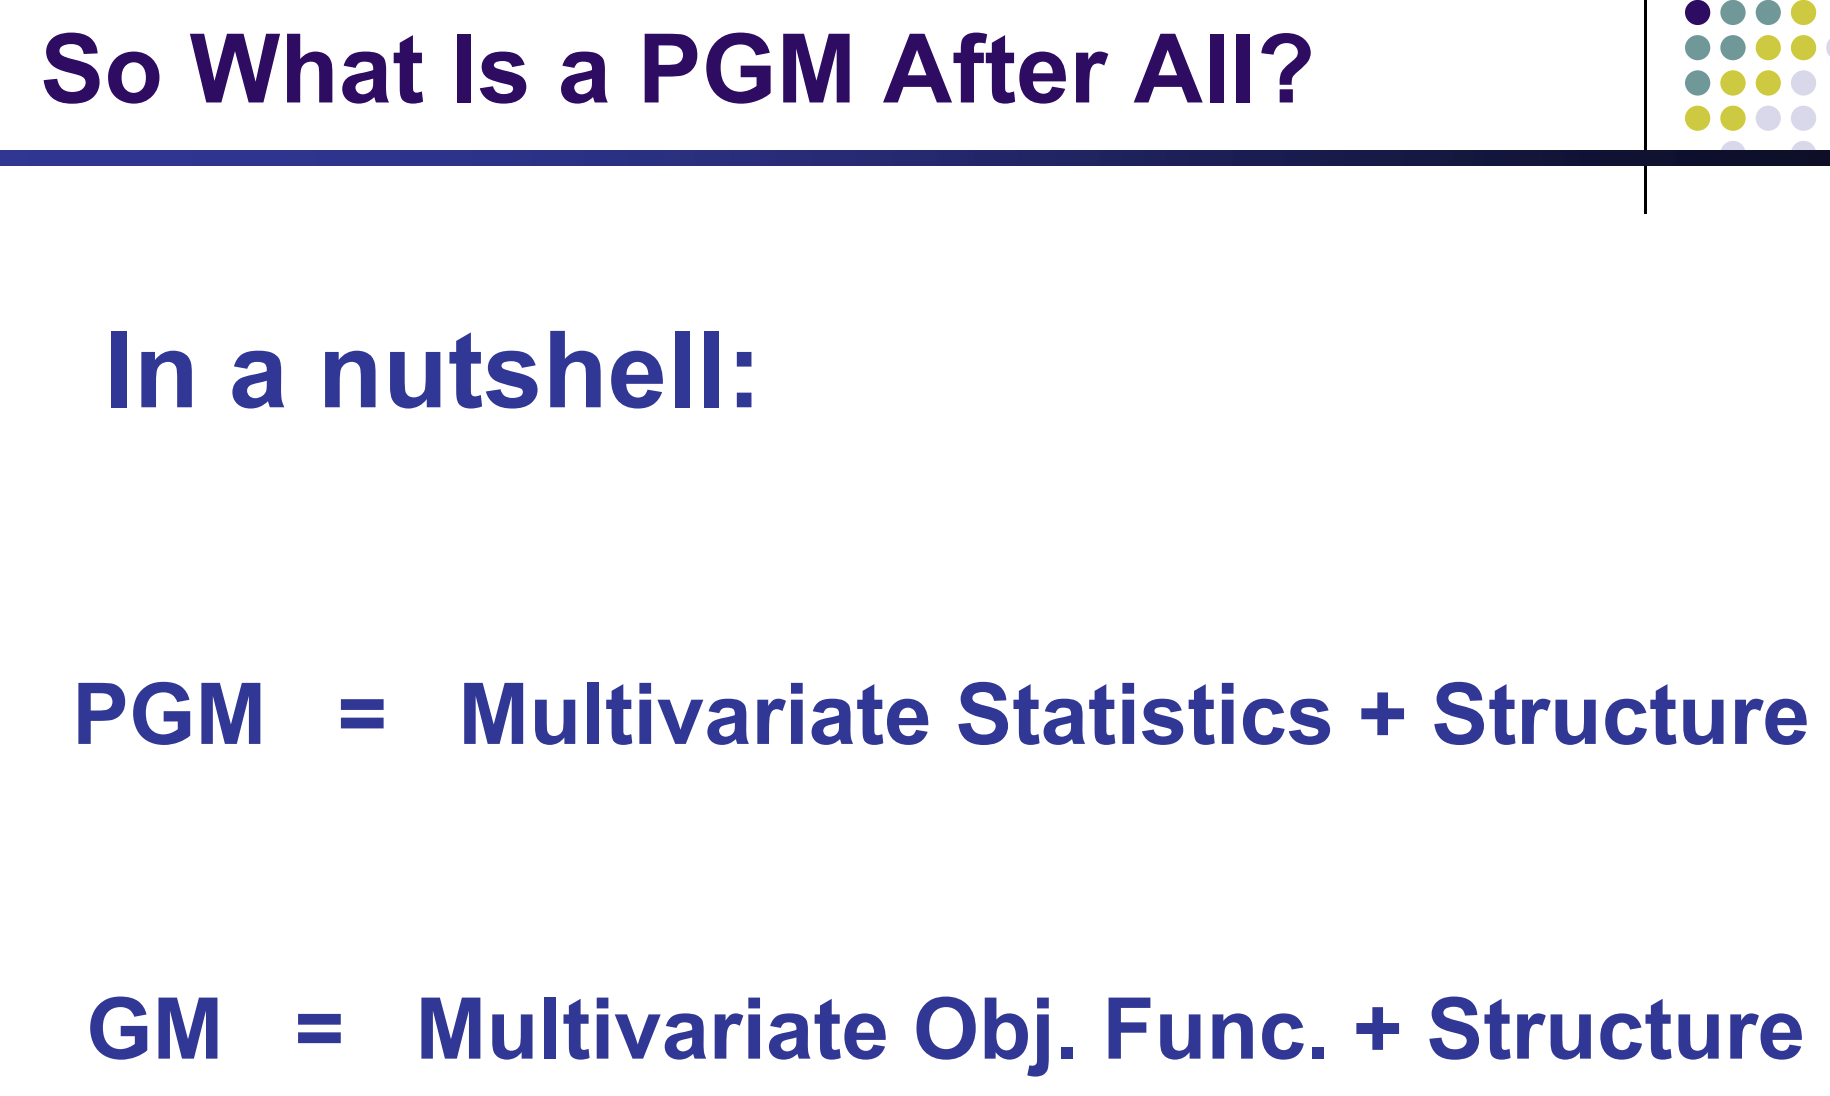
PGM => conditional distribution
GM => pm.Deterministic

If I have P(A,B), how to proof A is independent of B?
Method 1: defactorize P(A,B) = P(A)*P(B)
Method 2: build a graph like the one above, and A and B are automatically independent


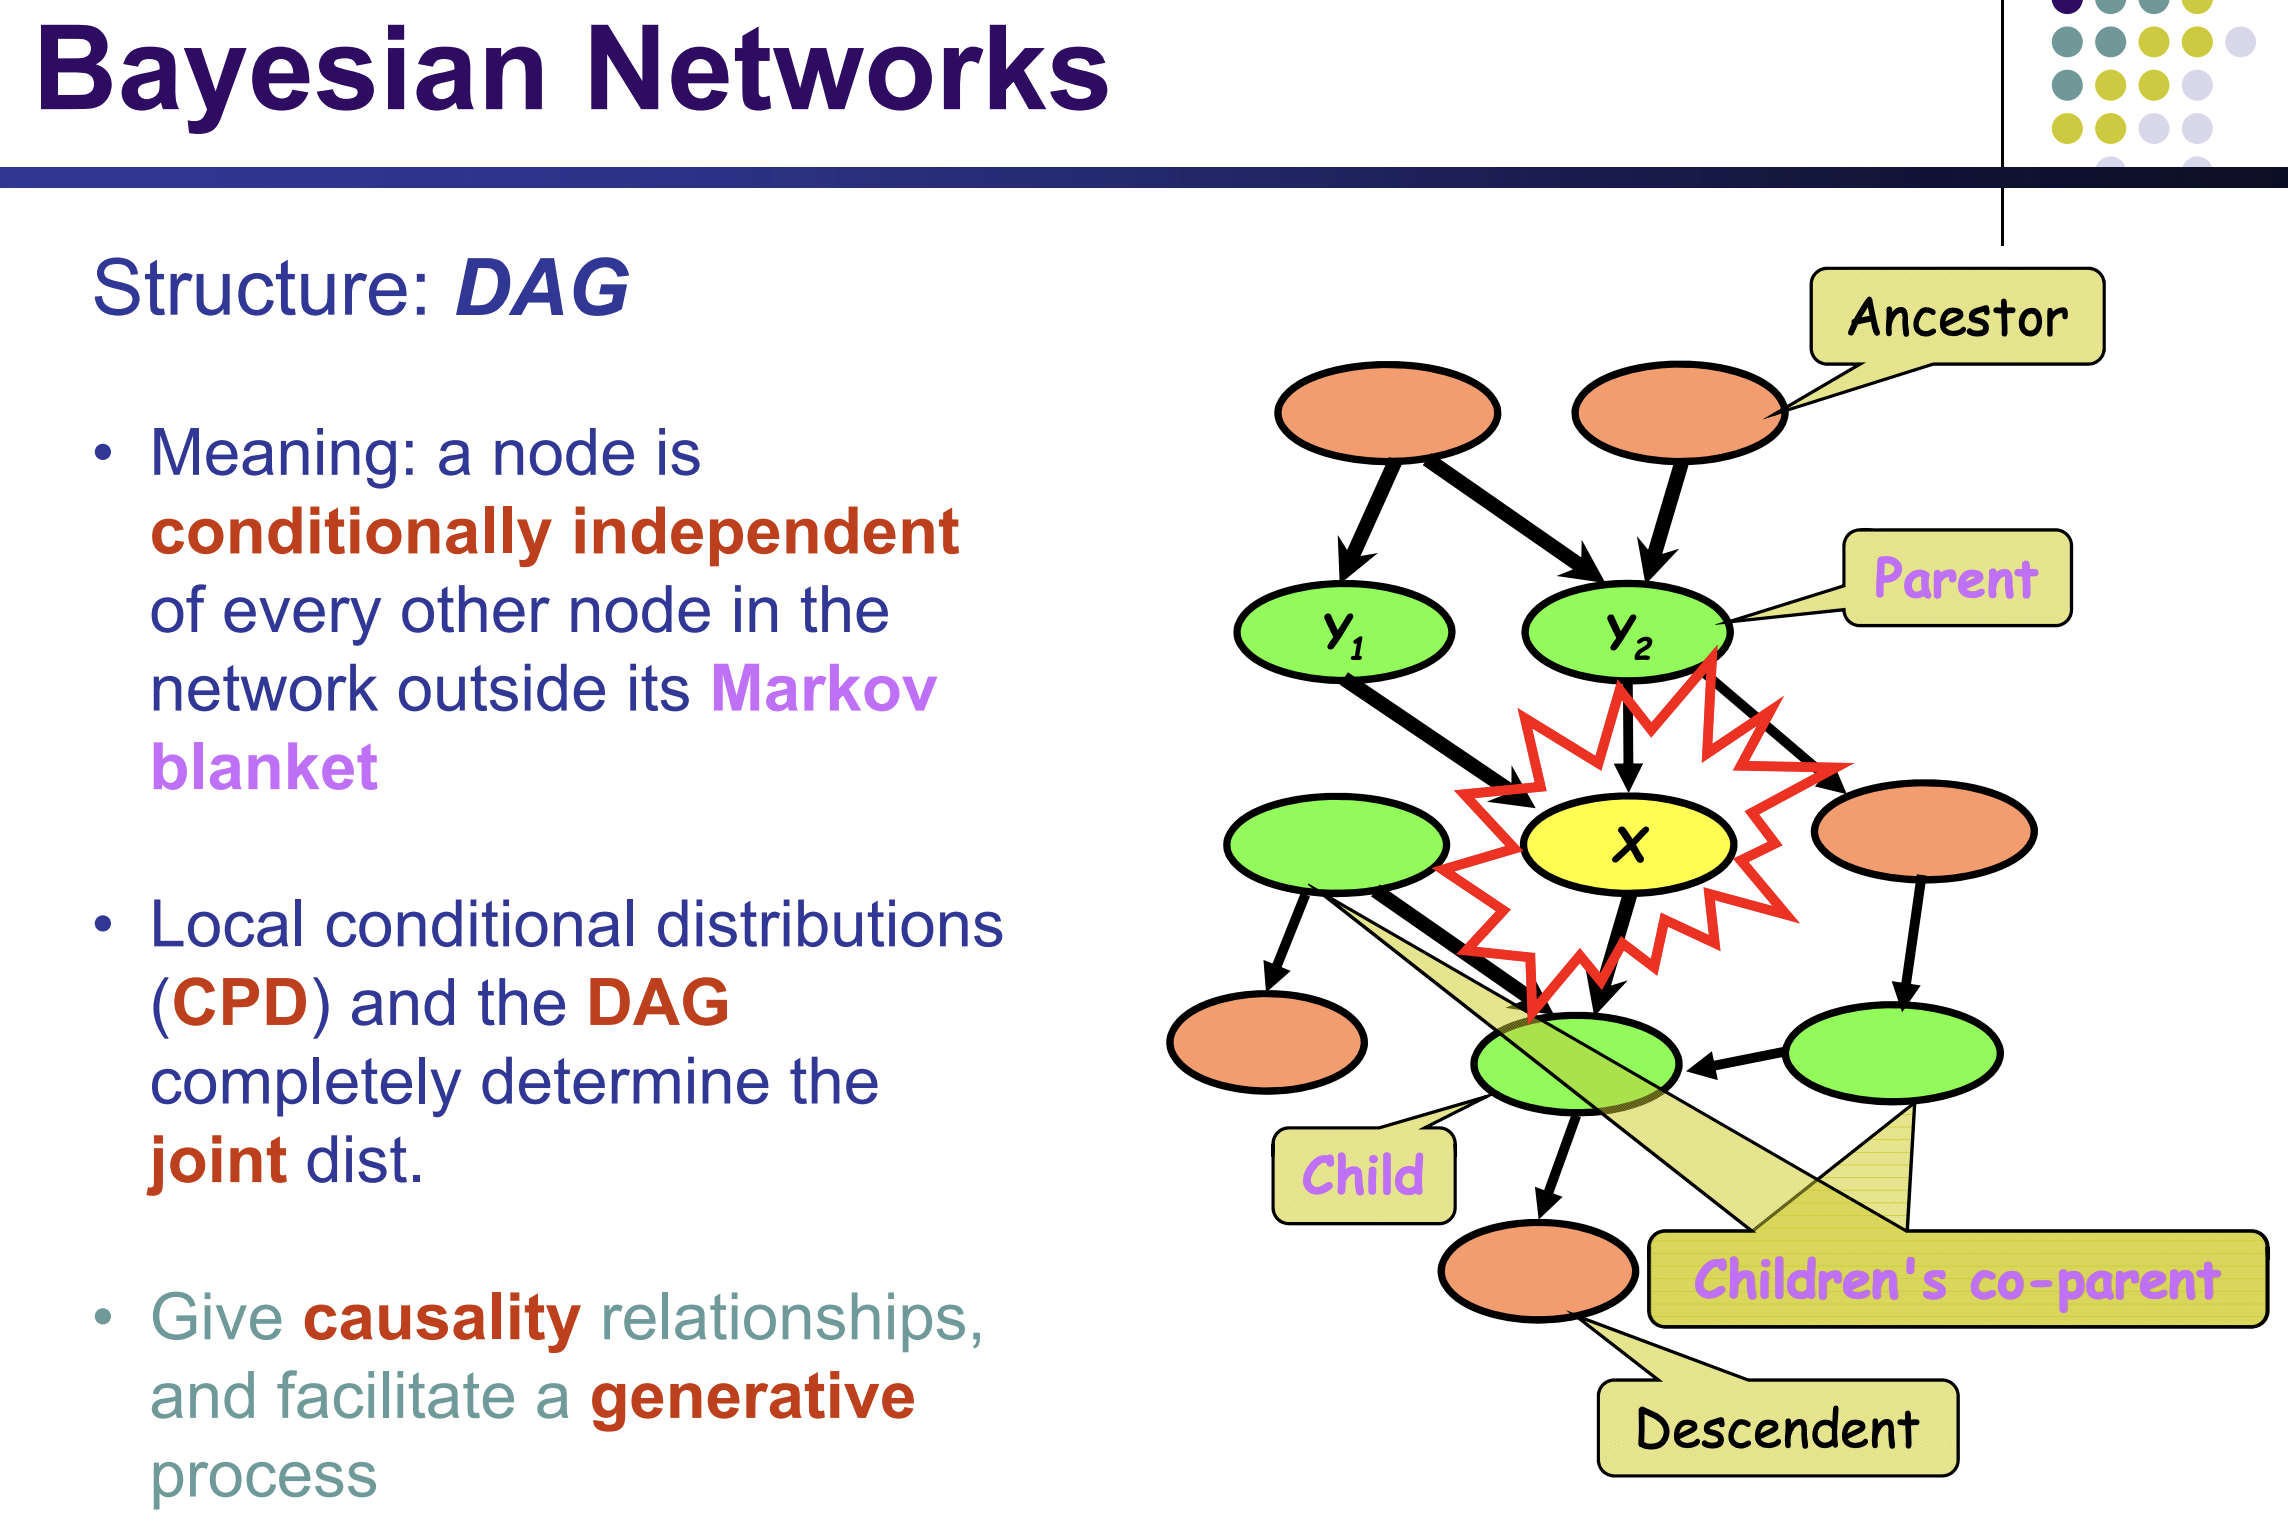
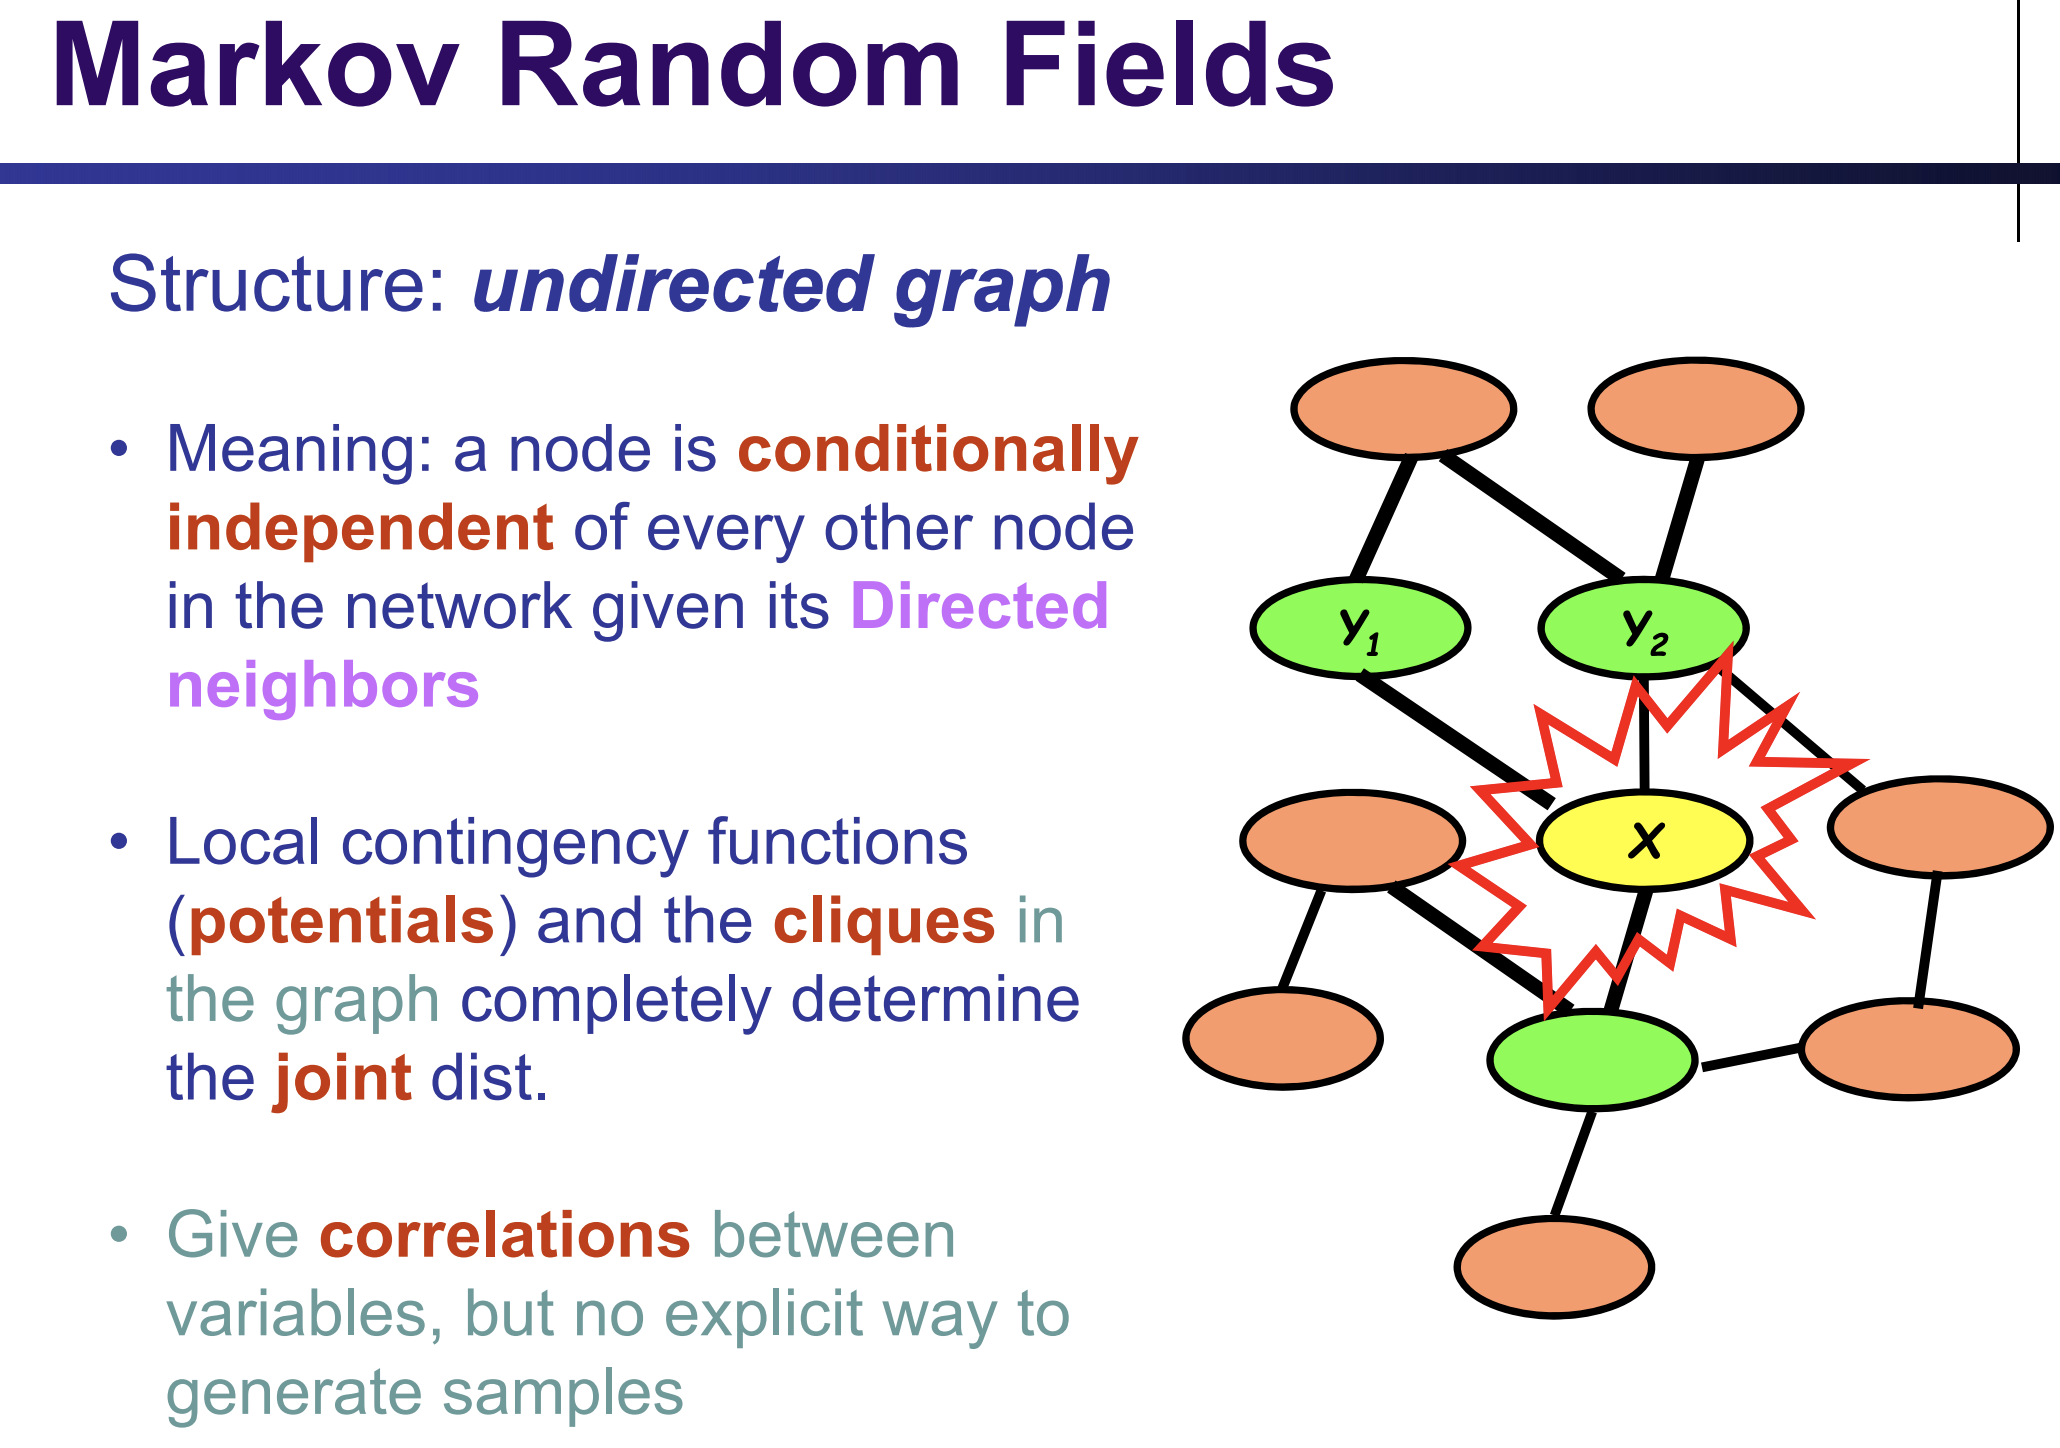
Yellow ⊥ Orange | Graph
the yellow node is only linked to its parents, children, and children's coparents (greeen nodes)
⊥: indenpendency

DARPA grand challenge

NLP
biostats