记录一下折线图学习成果,效果非常捧,在2个点之间还可以动画过渡,虽然在项目中没有使用上(数据量大,频繁添加点时,刷新慢;动态更新所有点的x坐标位置时,甚至出现程序卡死)
通过示例代码,可以学习到 ChartView 中使用 LineSeries/ValueAxis 画折线图的基本用法:
1. 修改坐标轴样式:字体,颜色,如何去掉文字,设置显示范围,显示格数等
2. QML 中定时器的用法
import QtQuick 2.0
import QtCharts 2.2

ChartView {
    id: chartView
    title: "ChartView"
    antialiasing: true
    backgroundColor: Qt.rgba(0, 0, 1, 0.1)
    animationOptions: ChartView.SeriesAnimations
    animationDuration: 1
    titleColor: Qt.rgba(0, 0, 0, 0.8)
    titleFont.bold: true
    titleFont.pointSize: 15
    legend.visible: false
    margins.left: 10
    margins.right: 10
    margins.top: 10
    margins.bottom: 10

    ValueAxis {
        id: myAxisX
        min: 0
        max: 6000
        tickCount: 20
        labelsColor: Qt.rgba(0, 0, 0, 0.9)
        labelsFont.pointSize: 13
        labelsFont.bold: true
        labelFormat: ' '
        color: Qt.rgba(0, 0, 1, 0.9)
    }

    ValueAxis{
        id: myAxisY
        min: 0
        max: 60000
        tickCount: 6
        labelsColor: Qt.rgba(0, 0, 0, 0.9)
        labelsFont.pointSize: 13
        labelsFont.bold: true
        labelFormat: '%d'
        color: Qt.rgba(0, 0, 1, 0.9)
    }

    LineSeries {
        id: lineSeries
        name: "LineSeries"
        axisX: myAxisX
        axisY: myAxisY
        color: Qt.rgba(1, 0, 0, 1)
         1
    }

    // FIXME 2021-08-07 : timer for test
    Timer {
        running: true
        interval: chartView.animationDuration
        repeat: true

        property int current: 0
        property int xValue: 0
        readonly property var valueList: [
            10000, 15000, 25000, 30000, 35000, 40000, 45000, 49700, 49800, 49900, 49950, 50000
            , 49950, 49900, 49800, 49700, 45000, 40000, 35000, 30000, 25000, 15000, 10000
        ]

        onTriggered: {
            var y = valueList[current]
            current = current + 1
            if (current >= valueList.length) {
                current = 0
            }

            var x = xValue
            xValue += 10
            if (xValue >= myAxisX.max) {
                lineSeries.clear()
                xValue = 0
                return
            }
            lineSeries.append(x, y)
        }
    }
}
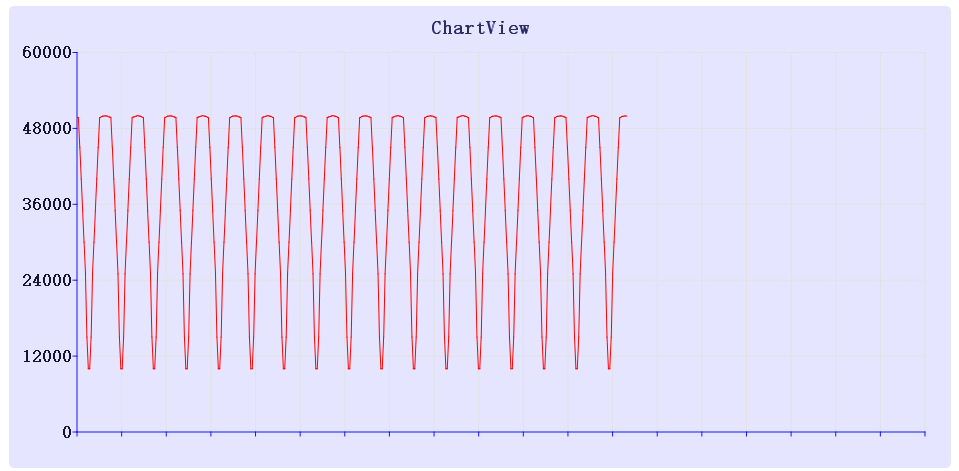
效果图