上一篇介绍了一些基本功能,包括一些方法:reindex(新索引)、drop(指定索引值丢弃某些项)、fill_value用来填充指定值、sort_index排序、rank排名等等。
其实有时候我并不知道这样写博客会不会有用,而且东西经常会忘记。不过希望每天都能学习一点吧!
一、统计方法
from pandas import DataFrame,Series
import pandas as pd
import numpy as np
df = DataFrame([[1.4,np.nan],[7.1,-4.5],
               [np.nan,np.nan],[0.75,-1.3]],
              index=['a','b','c','d'],
              columns=['one','two'])
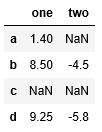
df

调用sum方法后:
df.sum()
返回一个对列求和的Series,其中NaN被当成0了:
one    9.25
two   -5.80
dtype: float64
按行求和:axis=1,NaN同样被看作0了:
df.sum(axis=1)
a    1.40
b    2.60
c    0.00
d   -0.55
dtype: float64
skipna:排除缺失值,默认为True。
上边的例子中NaN都被排除掉了,如果不想排除掉,就用skipna=False。
df.mean(axis=1,skipna=False)
a      NaN
b    1.300
c      NaN
d   -0.275
dtype: float64
idxmax方法:
df.idxmax()
one    b
two    d
dtype: object
返回达到最大值时的索引。
累积型的统计:例如cumsum方法:
df.cumsum()

累加求和,但索引c中都是NaN值。
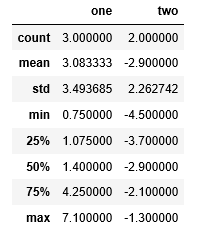
describe方法一次产生多个统计:
df.describe()

非数值情况下:
obj = Series(['a','a','b','c'] * 4)
obj.describe()
count     16
unique     3
top        a
freq       8
dtype: object
obj
0     a
1     a
2     b
3     c
4     a
5     a
6     b
7     c
8     a
9     a
10    b
11    c
12    a
13    a
14    b
15    c
dtype: object
其中,count统计非NaN的数量。
describe针对Series或DataFrame列计算汇总统计。
cumsum样本值的累计和。
二、相关系数和协方差
pct_change() : https://pandas.pydata.org/pandas-docs/stable/reference/api/pandas.DataFrame.pct_change.html
(当前值-前一刻值)/前一刻值(默认period为1)
s = pd.Series([1,2,3,4,5])
s.pct_change()
0         NaN
1    1.000000
2    0.500000
3    0.333333
4    0.250000
dtype: float64
perios=2:
s.pct_change(periods=2)

0         NaN
1         NaN
2    2.000000
3    1.000000
4    0.666667
dtype: float64
DataFrame同理,无参数时按列计算:
a = np.arange(1,13).reshape(6,2)
data = DataFrame(a)
print(data.pct_change())

          0         1
0       NaN       NaN
1  2.000000  1.000000
2  0.666667  0.500000
3  0.400000  0.333333
4  0.285714  0.250000
5  0.222222  0.200000
相关系数corr()与协方差cov():
a = np.arange(1,10).reshape(3,3)
data = DataFrame(a,index=['a','b','c'],columns=['one','two','three'])
data

计算第一列与第二列的相关系数:
data.one.corr(data.two)
1.0
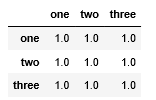
相关系数矩阵:
data.corr()

第一列与第二列的协方差:
data.one.cov(data.two)
9.0
协方差矩阵:
data.cov()
