3.1 使用图形
- plot:基础绘图
- abline:添加回归直线
- hist:绘制直方图
- boxplot:绘制箱线图
- dev.new():returns the return value of the device opened, usually invisible NULL.
- dev.cur(): returns a length-one named integer vector giving the number and name of the active device, or 1, the null device, if none is active.
- dev.list(): returns the numbers of all open devices, except device 1, the null device. This is a numeric vector with a names attribute giving the device names, or NULL is there is no open device.
- dev.next(which = dev.cur()):return the number and name of the next device in the list of devices. This will be the null device if and only if there are no open devices.
- dev.prev(which = dev.cur()): return the number and name of the previous device in the list of devices. This will be the null device if and only if there are no open devices.
- dev.off(which = dev.cur()): returns the number and name of the new active device (after the specified device has been shut down).
- dev.set(which = dev.next()): returns the number and name of the new active device.
- graphics.off()
Only one device is the ‘active’ device: this is the device in which all graphics operations occur. There is a "null device" which is always open but is really a placeholder: any attempt to use it will open a new device specified by getOption("device").
Devices are associated with a name (e.g., "X11" or "postscript") and a number in the range 1 to 63; the "null device" is always device 1. Once a device has been opened the null device is not considered as a possible active device. There is a list of open devices, and this is considered as a circular list not including the null device. dev.next and dev.prev select the next open device in the appropriate direction, unless no device is open.
3.2 一个简单的例子
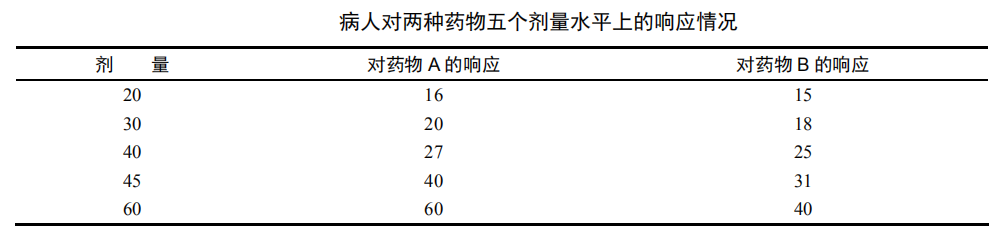
dose <- c(20, 30, 40, 45, 60)
drugA <- c(16, 20, 27, 40, 60)
drugB <- c(15, 18, 25, 31, 40)
plot(dose, drugA, type="b")

3.3 图形参数
- plot(x, y, ...): Generic function for plotting of R objects. For more details about the graphical parameter arguments, see par.
For simple scatter plots, plot.default will be used. However, there are plot methods for many R objects, including functions, data.frames, density objects, etc. Use methods(plot) and the documentation for these.
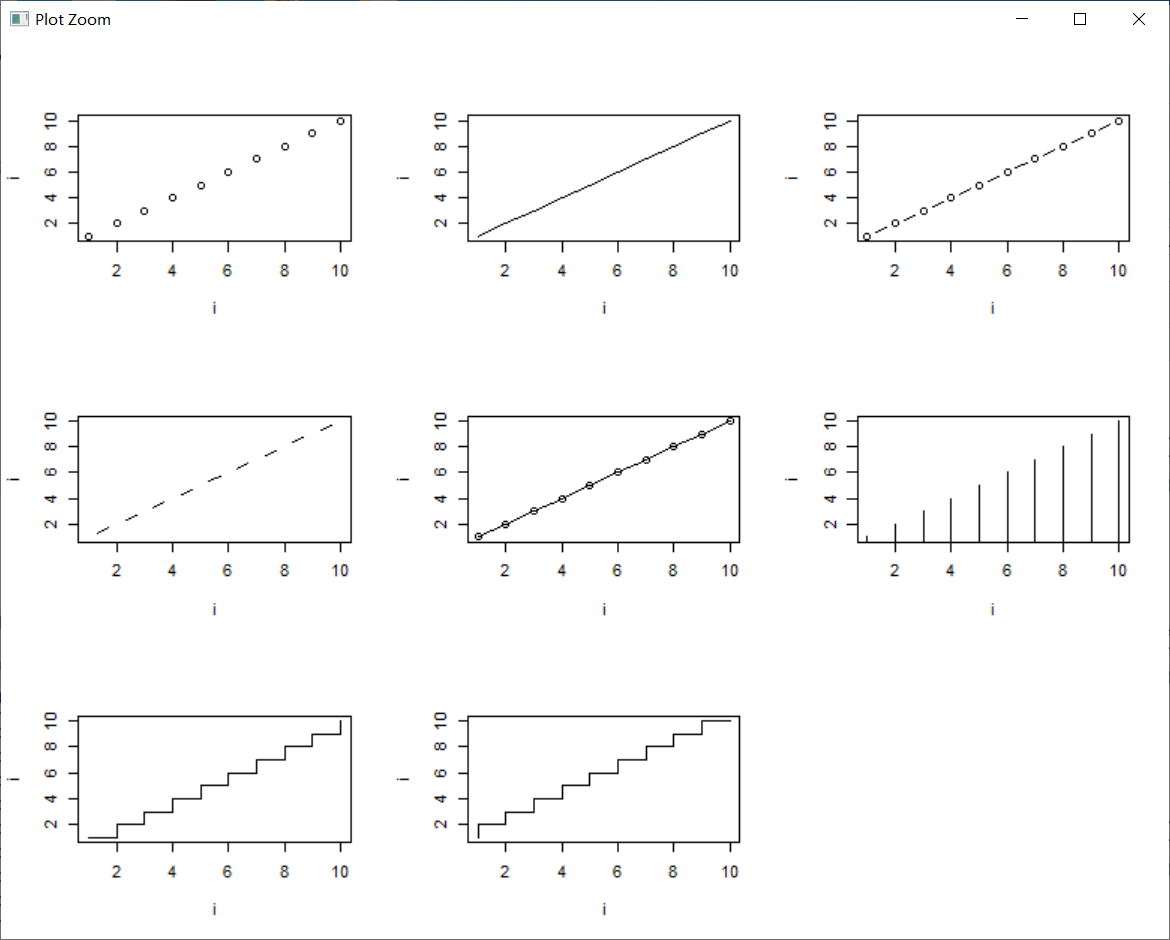
type: what type of plot should be drawn. Possible types are.
- "p" for points,
- "l" for lines,
- "b" for both,
- "c" for the lines part alone of "b",
- "o" for both ‘overplotted’,
- "h" for ‘histogram’ like (or ‘high-density’) vertical lines,
- "s" for stair steps,
- "S" for other steps, see ‘Details’ below,
- "n" for no plotting.
The two step types differ in their x-y preference: Going from (x1,y1) to (x2,y2) with x1 < x2, type = "s" moves first horizontal, then vertical, whereas type = "S" moves the other way around.
9种图形如下:
main: an overall title for the plot: see title.
sub: a sub title for the plot: see title.
xlab: a title for the x axis: see title.
ylab: a title for the y axis: see title.
asp: the y/x aspect ratio, see plot.window.(x和y的长宽比)
- par(..., no.readonly = FALSE)
par can be used to set or query(查询) graphical parameters. Parameters can be set by specifying them as arguments to par in tag = value form, or by passing them as a list of tagged values.(通过tag=value传递或者通过标记列表传递)
no.readonly: logical; if TRUE and there are no other arguments, only parameters are returned which can be set by a subsequent par() call on the same device.
| adj |
The value of adj determines the way in which text strings are justified in text, mtext and title. A value of 0 produces left-justified text, 0.5 (the default) centered text and 1 right-justified text. (Any value in [0, 1] is allowed.) Note that the adj argument of text also allows adj = c(x, y) for different adjustment in x- and y- directions. 确定文本和标题的对齐方式,0~1之间。 |
| ann | If set to FALSE, high-level plotting functions calling plot.default do not annotate the plots they produce with axis titles and overall titles. The default is to do annotation. |
| ask |
logical. If TRUE (and the R session is interactive) the user is asked for input, before a new figure is drawn. 在绘图前对用户进行提醒。 |
| bg |
The color to be used for the background of the device region. When called from par() it also sets new = FALSE. 可以通过颜色下标、颜色名称、十六进制的颜色值、RGB值或HSV值来指定颜色。举例来说,col=1、col="white"、col="#FFFFFF"、col=rgb(1,1,1)和col=hsv(0,0,1)都是表示白色的等价方式。 |
| bty |
A character string which determined the type of box which is drawn about plots. If bty is one of "o" (the default), "l", "7", "c", "u", or "]" the resulting box resembles the corresponding upper case letter. A value of "n" suppresses the box. 边框形状通过形状相似的字母或数字来定义,"n"代表没有边框。 |
| cex |
A numerical value giving the amount by which plotting text and symbols should be magnified relative to the default. This starts as 1 when a device is opened, and is reset when the layout is changed. 图形放大倍数。 |
| cex.axis | The magnification to be used for axis annotation relative to the current setting of cex. |
| cex.lab | The magnification to be used for x and y labels relative to the current setting of cex. |
| cex.main | The magnification to be used for main titles relative to the current setting of cex. |
| cex.sub | The magnification to be used for sub-titles relative to the current setting of cex. |
| cin |
R.O.; character size (width, height) in inches. 只读! > par()$cin [1] 0.15 0.20 |
| col | A specification for the default plotting color. |
| col.axis | The color to be used for axis annotation. Defaults to "black". |
| col.lab | The color to be used for x and y labels. Defaults to "black". |
| col.main | The color to be used for plot main titles. Defaults to "black". |
| col.sub | The color to be used for plot sub-titles. Defaults to "black". |
| cra |
R.O.; size of default character (width, height) in ‘rasters’ (pixels). > par()$cra [1] 14.4 19.2 |