因为最近工作需要,接触到了highcharts 与echarts ,对比了一下,目前公司系统用的是highcharts的图表插件,就不想再去用echarts的图标插件了,奈何highcharts地图对中国地图支持不友好,领导要求地图,没办法,逼着自己去尝试了一把echarts ,网上关于echarts地图下钻的资料真心少,要么是骗分的,要么是不正常的,或许是我不懂大神的写法吧,初入echarts ,小白一个,如果有写的不好的地方。大家莫怪,好了,废话不多说了。上代码,
最近用hicharts无意中发现了一个比较好看的国》省》市三级下钻的地图,附上链接
https://code.hcharts.cn/highmaps/FSSm7A
ECharts 之前提供下载的矢量地图数据来自第三方,由于部分数据不符合国家《测绘法》规定,目前暂时停止下载服务。
建议大家使用以百度地图为底图的形式,参考实例:http://echarts.baidu.com/demo.html#map-polygon
项目目录结构如下:

json 下面放的是全国的各个省的json文件,js下面放了个贵州省的json 与贵州省下面各市json,如需下载地图json,
各省json 下载地址:http://echarts.baidu.com/download-map.html
各省下面市的json下载地址:http://ecomfe.github.io/echarts-map-tool/
记得把如下选项选中,否则地图不会显示各县的边界线

2,文件下载完毕,接下来就是写代码咯,
<!DOCTYPE html>
<html>
<head>
<meta charset="UTF-8">
<meta http-equiv="X-UA-Compatible"content="IE=9; IE=8; IE=7; IE=EDGE" />
<link rel="stylesheet" href="css/index.css" />
<script type="text/javascript" src="Plugins/jquery-easyui/jquery.min.js"></script>
<script type="text/javascript" src="js/echarts.min.js" ></script>
<script>
function goBackProeMap(){
$('#cont_pro_map').css('display','block');
$('#cont_city_map').css('display','none');
$('.retPro').css('display','none');
}
</script>
</head>
<body>
<div class="main" style="1300px;height:;margin:50px auto;">
<div id="p" style="1300px;height:680px;padding:10px;background:#F6F8F7;">
<!--下属单位完成项目概况-->
<div class="proj fl pro_map" style="position: relative;">
<div class="proj_top">
<p>地图总览</p>
</div>
<div class="retPro">
<a href="javascript:void(0);" onclick="goBackProeMap()">
返回省级地图
</a>
</div>
<div id="cont_pro_map" style="580px;height:440px;float:left;position: absolute;left:10px;top:50px;z-index:1;"></div>
<div id="cont_city_map" style="580px;height:440px;float:left;display: none;position: absolute;left:10px;top:50px;z-index:99;"></div>
</div>
</div>
</div>
<script>
$().ready(function(){
/*echarts*/
$.get('js/guizhou.json', function (mapJson) {
echarts.registerMap('gui_zhou', mapJson);
var chart = echarts.init(document.getElementById('cont_pro_map'));//在id为mainMap的dom元素中显示地图
chart.setOption({
tooltip: {
trigger: 'item',
formatter: function loadData(result){//回调函数,参数params具体格式参加官方API
//鼠标放到某个地市上,显示这个地市的名称加人口数
//例如 params.name:当前地市名称。params.value:你传入的json数据与当前地市匹配的一项。
//params.data.value:你传入的json数据与当前地市匹配的一项中'value'对应的数据
return result.name+'<br />数据:'+result.value;
}
},
dataRange:{
min:0,
max:50,
splitNumber:0,
text:['高','低'],
realtime:false,
calculable:false,
selectedMode:false,
realtime:false,
itemWidth:10,
itemHeight:60,
color:['lightskyblue','#f2f2f2']
},
title:{
text:'贵州省各市区数据总览',
//subtext:'',
x:'center',
y:'top',
textAlign:'left'
},
series: [{
type: 'map',
map: 'gui_zhou',//要和echarts.registerMap()中第一个参数一致
scaleLimit: { min: 0.8, max: 1.9 },//缩放
mapLocation:{
y:60
},
itemSytle:{
emphasis:{label:{show:false}}
},
label: {
normal: {
show: true
},
emphasis: {
show: true
}
},
data : [
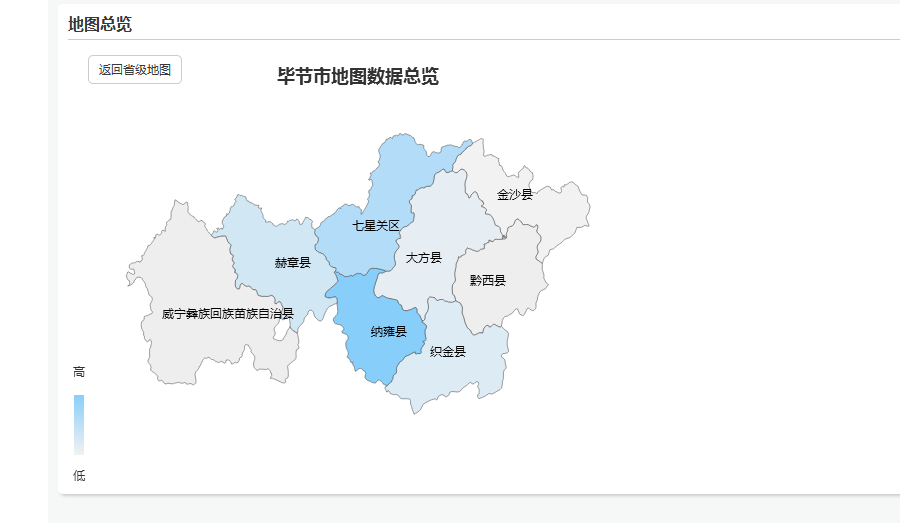
{name:'毕节市',value:'5'},
{name:'遵义市',value:'20'},
{name:'铜仁市',value:'10'},
{name:'六盘水市',value:'30'},
{name:'安顺市',value:'50'},
{name:'贵阳市',value:'15'},
{name:'黔东南苗族侗族自治州',value:'33'}
]//dataParam//人口数据:例如[{name:'济南',value:'100万'},{name:'菏泽',value:'100万'}......]
}]
}),
chart.on('click', function (result) {//回调函数,点击时触发,参数params格式参加官方API
setTimeout(function () {
$('#cont_pro_map').css('display','none');
$('#cont_city_map').css('display','block');
$('.retPro').css('display','block');
}, 500);
//选择地级市的单击事件
var selectCity = result.name;
//alert(selectCity);
// 调取后台数据
$.get('js/'+selectCity+'.json', function (Citymap) {
echarts.registerMap(selectCity, Citymap);
var myChartCity = echarts.init(document.getElementById('cont_city_map'));
myChartCity.setOption({
tooltip: {
trigger: 'item',
formatter: function loadData(result){//回调函数,参数params具体格式参加官方API
//鼠标放到某个地市上,显示这个地市的名称加人口数
//例如 params.name:当前地市名称。params.value:你传入的json数据与当前地市匹配的一项。
//params.data.value:你传入的json数据与当前地市匹配的一项中'value'对应的数据
return result.name+'<br />数据:'+result.value;
}
},
dataRange:{
min:0,
max:50,
text:['高','低'],
realtime:false,
calculable:false,
splitNumber:0,
itemWidth:10,
itemHeight:60,
color:['lightskyblue','#f2f2f2']
},
title:{
text:selectCity+'地图数据总览',
//subtext:'',
x:'center',
y:'top',
textAlign:'left'
},
series: [{
type: 'map',
map: selectCity ,//要和echarts.registerMap()中第一个参数一致
scaleLimit: { min: 0.8, max: 1.9 },//缩放
mapLocation:{
y:60
},
itemSytle:{
emphasis:{label:{show:false}}
},
label: {
normal: {
show: true
},
emphasis: {
show: true
}
},
data : [
{name:'大方县',value:'5'},
{name:'金沙县',value:'0'},
{name:'织金县',value:'10'},
{name:'七星关区',value:'30'},
{name:'纳雍县',value:'50'},
{name:'赫章县',value:'15'}
]//dataParam//人口数据:例如[{name:'济南',value:'100万'},{name:'菏泽',value:'100万'}......]
}]
})
myChartCity.on('click',function(rel){
setTimeout(function () {
//$('#cont_pro_map').css('display','block');
//$('#cont_city_map').css('display','none');
}, 500);
})
});
});
});
});
</script>
</body>
</html>
下面是css文件,
@charset "utf-8";
/* CSS Document */
body{margin:0;font-size:12px; color:#383838;line-height:1.8;font-family:"microsoft yahei";  }
form,ul,li,ol,li,dl,dt,dd,img,p,h1,h2,h3,h4,h5,h6,input,table,th,tr{margin:0;padding:0; }
h1,h2,h3,h4,h5,h6{font-size:12px;}
input,select{font-size:12px;outline: none;}
img{border:0;}
ul,li{list-style-type:none;}
strong,b{font-weight:bold;}
em {font-style:normal;}
h1,h2,h3,h4,h5,h6 {font-weight:normal;}
/* Link 全局链接样式 2012.7.28 */
a{color:#393939;text-decoration:none; cursor:pointer;}

.display_no{display:none;}
.display_yes{display:block;}
.fl{float:left}
.fr{float:right;}
.clear{clear:both;}

.main_top{100%;height:136px;}
.main_top .mdiv{display: inline-block;18.743333%;height:120px;background: #fff;display: block;float:left;margin:10px 20px 0px 0;}
.mdiv img {margin:30px 0 30px 20px;60px;}
.acsur{float:right;margin-right:10px;margin-top:25px;color:#fff; 120px;overflow: hidden;}
.acsur span{display: block;font-size:20px;text-align: center;}
.acsur p{font-size:24px;text-align: center;}
/*main_nav*/
.main_nav{35%;margin:15px 0;height:150px;background: #fff;float: left;border-radius: 5px;
box-shadow: 2px 2px 2px #ccc;}
.comp_top{margin:5px 10px;height:30px;line-height:30px;border-bottom:1px solid  #ccc;}
.comp_top P{font-size:16px;font-weight: bold;}
.comp_list{margin:5px 10px;height:100px;}
.comp_list ul li{margin-left:10px;float:left;list-style-type: none;120px;height:50px;margin-top:20px;border-right: 1px solid #f2f2f2;}
.comp_list ul li:last-child{border:none;}
.comp_list ul li p{text-align: center;font-size:24px;}
.comp_list ul li span{display:block;text-align: center;font-size:18px;}
.pro_bm{color:#FF9900;}
.pro_user{color:#14ABE4;}
.ml{float:right;}

/*comp_xj*/
.main_nav_cent{26.55555%;float:left;background: #fff;margin:15px 20px;height:150px;border-radius: 5px;
box-shadow: 2px 2px 2px #ccc;}
/*proj*/
.proj{49.2%;background: #fff;margin-top:5px;display: inline-block;margin-bottom: 20px;border-radius: 5px;
box-shadow: 2px 2px 2px #ccc;}
.proj_top{margin:5px 10px;height:30px;border-bottom: 1px solid #ccc;line-height:30px;}
.proj_top p{font-size:16px;font-weight: bold;}
.proj_row{100%;margin-top:40px;clear:both;background: #fff;border-radius: 5px;
box-shadow: 2px 2px 2px #ccc;margin-bottom: 20px;}

/*map*/
.pro_map{70%;height:490px;margin-bottom: 10px;}
.proj_map_list{29%;height:490px;background: #fff;border-radius: 5px;
box-shadow: 2px 2px 2px #ccc;margin-top:5px;}
#map_list ul li{margin:10px 10px;height:30px;line-height: 30px;font-size:14px;border: 1px solid #ccc;
    box-shadow: 1px 1px 1px #ccc;}
#map_list ul a{display: block;}
#map_list ul li span{float:left;margin-left:10px; 40%;border-right:1px solid #ccc;}
#map_list ul li em{font-style:normal;float:right;margin-right:10px;50%;height:30px;overflow: hidden;text-indent: 15px;}
.jh{color:#D84F4B;}
.wc{color:#FF0000;}
.ncl{color:#0088CC;}
.gd{color:#588EBD;}
.gs{color:#44B6AE;}
.zb{color:#14ABE4;}

.list{ 31%;height: 440px;float: right;margin-right: 10px;border-radius:5px;border:1px solid #f2f2f2;
    box-shadow: 2px 2px 2px #ccc;}

/*排名*/
.ranking ul li {margin:10px 20px;height:20px;line-height: 20px;font-size:16px;margin-top:20px;}
.ranking ul li span{float:left;margin-left:10px; 30%;overflow: hidden;height:20px;}
.ranking ul li em{font-style:normal;float:left;margin-left:10px;60%;height:20px;overflow: hidden;background: #d0ddf3;
position: relative;display: inline-block;}
.sp{display: inline-block;position: absolute;left:0;background: #029be5;height:20px;}
.sp_line{display: inline-block; 60%;text-align: center;color: #fff;z-index: 1;position: relative;font-size:14px;}

/*css3动画效果*/
#cont_pro_map{
	-moz-transition: all .2s ease-out 0s;
		    -o-transition: all .2s ease-out 0s;
		    -webkit-transition: all .2s ease-out;
		    -webkit-transition-delay: 0s;
		    transition: all .2s ease-out 0s;
}
#cont_city_map{
	-moz-transition: all .2s ease-out 0s;
		    -o-transition: all .2s ease-out 0s;
		    -webkit-transition: all .2s ease-out;
		    -webkit-transition-delay: 0s;
		    transition: all .2s ease-out 0s;

}
/*返回省级地图按钮*/
.retPro{z-index:999;position: absolute;top:50px;left:10px;display: none;}
.retPro a{height:30px;line-height: 30px;border:1px solid #ccc;padding:5px 10px;margin-left:20px;border-radius:5px;cursor: pointer;}
记得在js下面引入省的json 与 省下市的地图json
最后来张效果图

本文为作者原创,转载请注明
附上百度网盘:http://pan.baidu.com/s/1nvRwLGt
github:https://github.com/oliverdai/echarts
如不能下载,请留言