• 使用ELK(Elasticsearch + Logstash + Kibana) 搭建日志集中分析平台实践--转载


    原文地址:https://wsgzao.github.io/post/elk/

    另外可以参考:https://www.digitalocean.com/community/tutorials/how-to-install-elasticsearch-logstash-and-kibana-elk-stack-on-ubuntu-14-04

    前言

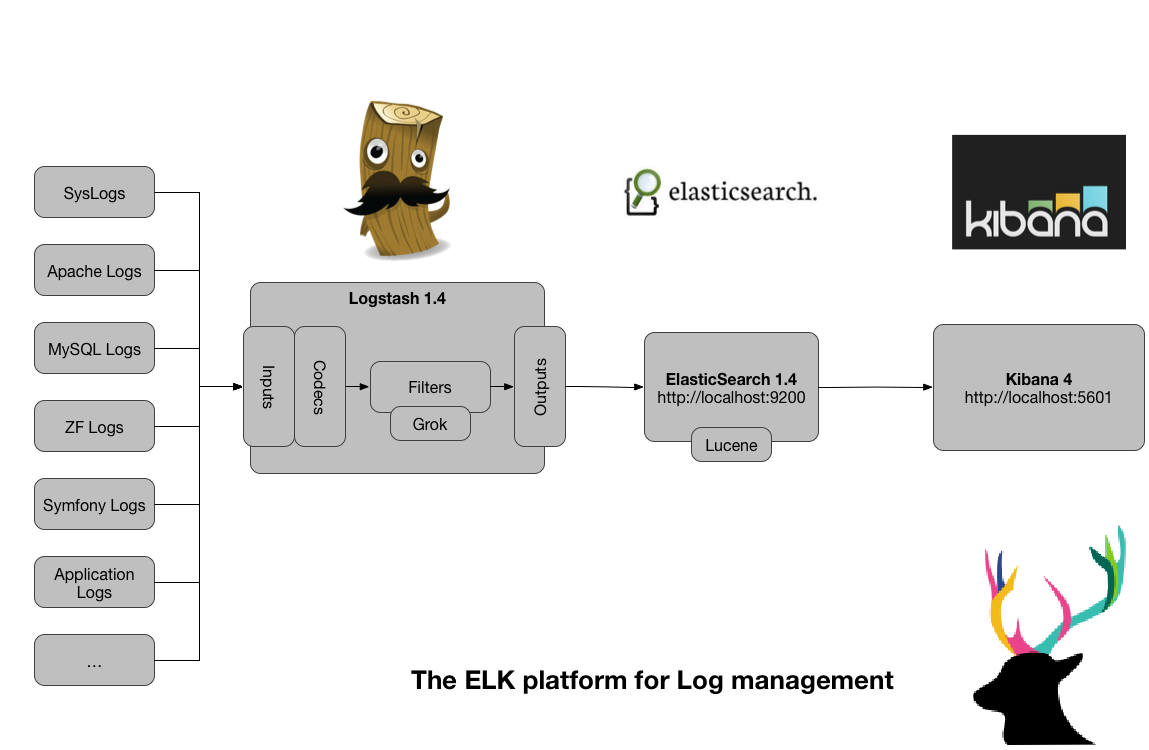
    Elasticsearch + Logstash + Kibana(ELK)是一套开源的日志管理方案,分析网站的访问情况时我们一般会借助Google/百度/CNZZ等方式嵌入JS做数据统计,但是当网站访问异常或者被攻击时我们需要在后台分析如Nginx的具体日志,而Nginx日志分割/GoAccess/Awstats都是相对简单的单节点解决方案,针对分布式集群或者数据量级较大时会显得心有余而力不足,而ELK的出现可以使我们从容面对新的挑战。

    • Logstash:负责日志的收集,处理和储存
    • Elasticsearch:负责日志检索和分析
    • Kibana:负责日志的可视化

    ELK(Elasticsearch + Logstash + Kibana)


    更新记录

    2015年08月31日 - 初稿

    阅读原文 - http://wsgzao.github.io/post/elk/

    扩展阅读

    CentOS 7.x安装ELK(Elasticsearch+Logstash+Kibana) - http://www.chenshake.com/centos-install-7-x-elk-elasticsearchlogstashkibana/
    Centos 6.5 安装nginx日志分析系统 elasticsearch + logstash + redis + kibana - http://blog.chinaunix.net/xmlrpc.php?r=blog/article&uid=17291169&id=4898582
    logstash-forwarder and grok examples - https://www.ulyaoth.net/threads/logstash-forwarder-and-grok-examples.32413/
    三斗室 - http://chenlinux.com/
    elastic - https://www.elastic.co/guide
    LTMP索引 - http://wsgzao.github.io/index/#LTMP


    组件预览

    JDK - http://www.oracle.com/technetwork/java/javase/downloads/index.html
    Elasticsearch - https://www.elastic.co/downloads/elasticsearch
    Logstash - https://www.elastic.co/downloads/logstash
    Kibana - https://www.elastic.co/downloads/kibana
    redis - http://redis.io/download

    设置FQDN

    创建SSL证书的时候需要配置FQDN

    1
    2
    3
    4
    5
    6
    7
    8
    9
    10
    11
    12
    13
    14
    15
    16
    17
    18
    19
    20
    21
    22
    23

    #修改hostname
    cat /etc/hostname
    elk

    #修改hosts
    cat /etc/hosts

    127.0.0.1 localhost localhost.localdomain localhost4 localhost4.localdomain4
    ::1 localhost localhost.localdomain localhost6 localhost6.localdomain6

    127.0.0.1 10-10-87-19
    10.10.87.19 elk.ooxx.com elk

    #刷新环境
    hostname -F /etc/hostname

    #复查结果
    hostname -f
    elk.ooxx.com

    hostname
    elk

    服务端

    Java

    1
    2
    3
    4
    5
    6
    7
    8
    9
    cat /etc/redhat-release
    CentOS release 6.5 (Final)

    yum install java-1.7.0-openjdk
    java -version

    java version "1.7.0_85"
    OpenJDK Runtime Environment (rhel-2.6.1.3.el6_6-x86_64 u85-b01)
    OpenJDK 64-Bit Server VM (build 24.85-b03, mixed mode)

    Elasticsearch

    1
    2
    3
    4
    5
    6
    7
    8
    9
    10
    11
    12
    13
    14
    15
    16
    17
    18
    19
    20
    21
    22
    23
    24
    25
    26
    27
    28
    29
    30
    31
    32

    #下载安装
    wget https://download.elastic.co/elasticsearch/elasticsearch/elasticsearch-1.7.1.noarch.rpm
    yum localinstall elasticsearch-1.7.1.noarch.rpm

    #启动相关服务
    service elasticsearch start
    service elasticsearch status

    #查看Elasticsearch的配置文件
    rpm -qc elasticsearch

    /etc/elasticsearch/elasticsearch.yml
    /etc/elasticsearch/logging.yml
    /etc/init.d/elasticsearch
    /etc/sysconfig/elasticsearch
    /usr/lib/sysctl.d/elasticsearch.conf
    /usr/lib/systemd/system/elasticsearch.service
    /usr/lib/tmpfiles.d/elasticsearch.conf

    #查看端口使用情况
    netstat -nltp

    Active Internet connections (only servers)
    Proto Recv-Q Send-Q Local Address Foreign Address State PID/Program name
    tcp 0 0 0.0.0.0:9200 0.0.0.0:* LISTEN 1765/java
    tcp 0 0 0.0.0.0:9300 0.0.0.0:* LISTEN 1765/java
    tcp 0 0 0.0.0.0:22 0.0.0.0:* LISTEN 1509/sshd
    tcp 0 0 :::22 :::* LISTEN 1509/sshd

    #测试访问
    curl -X GET http://localhost:9200/

    Kibana

    1
    2
    3
    4
    5
    6
    7
    8
    9
    10
    11
    12
    13
    14
    15
    16
    17
    18
    19
    20
    21
    22
    23
    24
    25
    26
    27
    28
    29
    30
    31
    32
    33
    34
    35
    36
    37
    38
    39
    40
    41
    42
    43
    44
    45
    46
    47
    48
    49
    50
    51
    52
    53
    54
    55
    56
    57
    58
    59
    60
    61
    62
    63
    64
    65
    66
    67
    68
    69
    70
    71
    72
    73
    74
    75
    76
    77
    78
    79
    80
    81
    82
    83
    84
    85
    86
    87
    88
    89
    90
    91
    92
    93
    94
    95
    96
    97
    98
    99
    100
    101
    102
    103
    104
    105
    106
    107
    108
    109
    110
    111
    112
    113
    114
    115
    116
    117
    118
    119
    120
    121
    122
    123
    124
    125
    126
    127
    128
    129
    130

    #下载tar包
    wget https://download.elastic.co/kibana/kibana/kibana-4.1.1-linux-x64.tar.gz
    #解压
    tar zxf kibana-4.1.1-linux-x64.tar.gz -C /usr/local/
    cd /usr/local/
    mv kibana-4.1.1-linux-x64 kibana

    #创建kibana服务
    vi /etc/rc.d/init.d/kibana

    #!/bin/bash
    ### BEGIN INIT INFO
    # Provides: kibana
    # Default-Start: 2 3 4 5
    # Default-Stop: 0 1 6
    # Short-Description: Runs kibana daemon
    # Description: Runs the kibana daemon as a non-root user
    ### END INIT INFO

    # Process name
    NAME=kibana
    DESC="Kibana4"
    PROG="/etc/init.d/kibana"

    # Configure location of Kibana bin
    KIBANA_BIN=/usr/local/kibana/bin

    # PID Info
    PID_FOLDER=/var/run/kibana/
    PID_FILE=/var/run/kibana/$NAME.pid
    LOCK_FILE=/var/lock/subsys/$NAME
    PATH=/bin:/usr/bin:/sbin:/usr/sbin:$KIBANA_BIN
    DAEMON=$KIBANA_BIN/$NAME

    # Configure User to run daemon process
    DAEMON_USER=root
    # Configure logging location
    KIBANA_LOG=/var/log/kibana.log

    # Begin Script
    RETVAL=0

    if [ `id -u` -ne 0 ]; then
    echo "You need root privileges to run this script"
    exit 1
    fi

    # Function library
    . /etc/init.d/functions

    start() {
    echo -n "Starting $DESC : "

    pid=`pidofproc -p $PID_FILE kibana`
    if [ -n "$pid" ] ; then
    echo "Already running."
    exit 0
    else
    # Start Daemon
    if [ ! -d "$PID_FOLDER" ] ; then
    mkdir $PID_FOLDER
    fi
    daemon --user=$DAEMON_USER --pidfile=$PID_FILE $DAEMON 1>"$KIBANA_LOG" 2>&1 &
    sleep 2
    pidofproc node > $PID_FILE
    RETVAL=$?
    [[ $? -eq 0 ]] && success || failure
    echo
    [ $RETVAL = 0 ] && touch $LOCK_FILE
    return $RETVAL
    fi
    }

    reload()
    {
    echo "Reload command is not implemented for this service."
    return $RETVAL
    }

    stop() {
    echo -n "Stopping $DESC : "
    killproc -p $PID_FILE $DAEMON
    RETVAL=$?
    echo
    [ $RETVAL = 0 ] && rm -f $PID_FILE $LOCK_FILE
    }

    case "$1" in
    start)
    start
    ;;
    stop)
    stop
    ;;
    status)
    status -p $PID_FILE $DAEMON
    RETVAL=$?
    ;;
    restart)
    stop
    start
    ;;
    reload)
    reload
    ;;
    *)
    # Invalid Arguments, print the following message.
    echo "Usage: $0 {start|stop|status|restart}" >&2
    exit 2
    ;;
    esac

    #修改启动权限
    chmod +x /etc/rc.d/init.d/kibana

    #启动kibana服务
    service kibana start
    service kibana status

    #查看端口
    netstat -nltp

    Active Internet connections (only servers)
    Proto Recv-Q Send-Q Local Address Foreign Address State PID/Program name
    tcp 0 0 0.0.0.0:9200 0.0.0.0:* LISTEN 1765/java
    tcp 0 0 0.0.0.0:9300 0.0.0.0:* LISTEN 1765/java
    tcp 0 0 0.0.0.0:22 0.0.0.0:* LISTEN 1509/sshd
    tcp 0 0 0.0.0.0:5601 0.0.0.0:* LISTEN 1876/node
    tcp 0 0 :::22 :::* LISTEN 1509/sshd

    Logstash

    1
    2
    3
    4
    5
    6
    7
    8
    9
    10
    11
    12
    13
    14
    15
    16
    17
    18
    19
    20
    21
    22
    23
    24
    25
    26
    27
    28
    29
    30
    31
    32
    33
    34
    35
    36
    37
    38
    39
    40
    41
    42
    43
    44
    45
    46
    47
    48
    49
    50
    51
    52
    53
    54
    55
    56
    57
    58
    59
    60
    61
    62
    63
    64
    65
    66
    67
    68
    69
    70
    71

    #下载rpm包
    wget https://download.elastic.co/logstash/logstash/packages/centos/logstash-1.5.4-1.noarch.rpm
    #安装
    yum localinstall logstash-1.5.4-1.noarch.rpm

    #设置ssl,之前设置的FQDN是elk.ooxx.com
    cd /etc/pki/tls
    #openssl req -x509 -batch -nodes -newkey rsa:2048 -keyout lumberjack.key -out lumberjack.crt -subj /CN=logstash.example.com
    openssl req -subj '/CN=elk.ooxx.com/' -x509 -days 3650 -batch -nodes -newkey rsa:2048 -keyout private/logstash-forwarder.key -out certs/logstash-forwarder.crt


    #创建一个01-logstash-initial.conf文件
    cat > /etc/logstash/conf.d/01-logstash-initial.conf << EOF
    input {
    lumberjack {
    port => 5000
    type => "logs"
    ssl_certificate => "/etc/pki/tls/certs/logstash-forwarder.crt"
    ssl_key => "/etc/pki/tls/private/logstash-forwarder.key"
    }
    }


    filter {
    if [type] == "syslog" {
    grok {
    match => { "message" => "%{SYSLOGTIMESTAMP:syslog_timestamp} %{SYSLOGHOST:syslog_hostname} %{DATA:syslog_program}(?:[%{POSINT:syslog_pid}])?: %{GREEDYDATA:syslog_message}" }
    add_field => [ "received_at", "%{@timestamp}" ]
    add_field => [ "received_from", "%{host}" ]
    }
    syslog_pri { }
    date {
    match => [ "syslog_timestamp", "MMM d HH:mm:ss", "MMM dd HH:mm:ss" ]
    }
    }
    }

    output {
    elasticsearch { host => localhost }
    stdout { codec => rubydebug }
    }
    EOF

    #启动logstash服务
    service logstash start
    service logstash status

    #查看5000端口
    netstat -nltp

    Active Internet connections (only servers)
    Proto Recv-Q Send-Q Local Address Foreign Address State PID/Program name
    tcp 0 0 0.0.0.0:9200 0.0.0.0:* LISTEN 1765/java
    tcp 0 0 0.0.0.0:9300 0.0.0.0:* LISTEN 1765/java
    tcp 0 0 0.0.0.0:9301 0.0.0.0:* LISTEN 2309/java
    tcp 0 0 0.0.0.0:22 0.0.0.0:* LISTEN 1509/sshd
    tcp 0 0 0.0.0.0:5601 0.0.0.0:* LISTEN 1876/node
    tcp 0 0 0.0.0.0:5000 0.0.0.0:* LISTEN 2309/java
    tcp 0 0 :::22 :::* LISTEN 1509/sshd


    #启动服务
    service logstash-forwarder start
    service logstash-forwarder status

    #访问Kibana,Time-field name 选择 @timestamp
    http://localhost:5601/

    #增加节点和客户端配置一样,注意同步证书
    /etc/pki/tls/certs/logstash-forwarder.crt

    客户端

    Logstash Forwarder

    1
    2
    3
    4
    5
    6
    7
    8
    9
    10
    11
    12
    13
    14
    15
    16
    17
    18
    19
    20
    21
    22
    23
    24
    25
    26
    27
    28
    29
    30
    31
    32
    33
    34
    35
    36

    #登陆到客户端,安装Logstash Forwarder
    wget https://download.elastic.co/logstash-forwarder/binaries/logstash-forwarder-0.4.0-1.x86_64.rpm
    yum localinstall logstash-forwarder-0.4.0-1.x86_64.rpm

    #查看logstash-forwarder的配置文件位置
    rpm -qc logstash-forwarder
    /etc/logstash-forwarder.conf

    #备份配置文件
    cp /etc/logstash-forwarder.conf /etc/logstash-forwarder.conf.save

    #编辑 /etc/logstash-forwarder.conf,需要根据实际情况进行修改

    cat > /etc/logstash-forwarder.conf << EOF
    {
    "network": {
    "servers": [ "elk.ooxx.com:5000" ],

    "ssl ca": "/etc/pki/tls/certs/logstash-forwarder.crt",

    "timeout": 15
    },

    "files": [
    {
    "paths": [
    "/var/log/messages",
    "/var/log/secure"
    ],

    "fields": { "type": "syslog" }
    }
    ]
    }
    EOF

    配置Nginx日志策略

    1
    2
    3
    4
    5
    6
    7
    8
    9
    10
    11
    12
    13
    14
    15
    16
    17
    18
    19
    20
    21
    22
    23
    24
    25
    26
    27
    28
    29
    30
    31
    32
    33
    34
    35
    36
    37
    38
    39
    40
    41
    42
    43
    44
    45
    46
    47
    48
    49
    50
    51
    52
    53
    54
    55
    56
    57
    58
    59
    60
    61
    62
    63
    64
    65
    66
    67
    68
    69
    70
    71
    72
    73
    74
    75
    76
    77
    78
    79

    #修改客户端配置
    vi /etc/logstash-forwarder.conf

    {
    "network": {
    "servers": [ "elk.ooxx.com:5000" ],

    "ssl ca": "/etc/pki/tls/certs/logstash-forwarder.crt",

    "timeout": 15
    },

    "files": [
    {
    "paths": [
    "/var/log/messages",
    "/var/log/secure"
    ],
    "fields": { "type": "syslog" }
    }, {
    "paths": [
    "/app/local/nginx/logs/access.log"
    ],
    "fields": { "type": "nginx" }
    }
    ]
    }

    #服务端增加patterns
    mkdir /opt/logstash/patterns
    vi /opt/logstash/patterns/nginx

    NGUSERNAME [a-zA-Z.@-+_%]+
    NGUSER %{NGUSERNAME}
    NGINXACCESS %{IPORHOST:remote_addr} - - [%{HTTPDATE:time_local}] "%{WORD:method} %{URIPATH:path}(?:%{URIPARAM:param})? HTTP/%{NUMBER:httpversion}" %{INT:status} %{INT:body_bytes_sent} %{QS:http_referer} %{QS:http_user_agent}

    #官网pattern的debug在线工具
    https://grokdebug.herokuapp.com/

    #修改logstash权限
    chown -R logstash:logstash /opt/logstash/patterns

    #修改服务端配置
    vi /etc/logstash/conf.d/01-logstash-initial.conf

    input {
    lumberjack {
    port => 5000
    type => "logs"
    ssl_certificate => "/etc/pki/tls/certs/logstash-forwarder.crt"
    ssl_key => "/etc/pki/tls/private/logstash-forwarder.key"
    }
    }


    filter {
    if [type] == "syslog" {
    grok {
    match => { "message" => "%{SYSLOGTIMESTAMP:syslog_timestamp} %{SYSLOGHOST:syslog_hostname} %{DATA:syslog_program}(?:[%{POSINT:syslog_pid}])?: %{GREEDYDATA:syslog_message}" }
    add_field => [ "received_at", "%{@timestamp}" ]
    add_field => [ "received_from", "%{host}" ]
    }
    syslog_pri { }
    date {
    match => [ "syslog_timestamp", "MMM d HH:mm:ss", "MMM dd HH:mm:ss" ]
    }
    }
    if [type] == "nginx" {
    grok {
    match => { "message" => "%{NGINXACCESS}" }
    }
    }
    }

    output {
    elasticsearch { host => localhost }
    stdout { codec => rubydebug }
    }

    其它注意事项

    修改kibana端口

    1
    2
    3
    4
    5
    6
    7
    8
    9
    10
    11
    12
    13
    14
    15
    16
    17
    18
    19
    20
    21
    22
    23
    24
    25
    26
    27
    28
    29
    30
    31
    32
    33
    34
    35
    36
    37
    38
    39
    40
    41
    42
    43
    44
    45
    46
    47
    48
    49
    50
    51
    52
    53
    54
    55
    56
    57
    58
    59
    60
    61
    62
    63
    64
    65
    66
    67
    68
    69
    70
    71
    72
    73
    74
    75
    76
    77
    78
    79
    80
    81
    82
    #编辑kibana.yaml
    vi /usr/local/kibana/config/kibana.yml


    # Kibana is served by a back end server. This controls which port to use.
    #port: 5601
    port: 80

    # The host to bind the server to.
    host: "0.0.0.0"

    # The Elasticsearch instance to use for all your queries.
    elasticsearch_url: "http://localhost:9200"

    # preserve_elasticsearch_host true will send the hostname specified in `elasticsearch`. If you set it to false,
    # then the host you use to connect to *this* Kibana instance will be sent.
    elasticsearch_preserve_host: true

    # Kibana uses an index in Elasticsearch to store saved searches, visualizations
    # and dashboards. It will create a new index if it doesn't already exist.
    kibana_index: ".kibana"

    # If your Elasticsearch is protected with basic auth, this is the user credentials
    # used by the Kibana server to perform maintence on the kibana_index at statup. Your Kibana
    # users will still need to authenticate with Elasticsearch (which is proxied thorugh
    # the Kibana server)
    # kibana_elasticsearch_username: user
    # kibana_elasticsearch_password: pass

    # If your Elasticsearch requires client certificate and key
    # kibana_elasticsearch_client_crt: /path/to/your/client.crt
    # kibana_elasticsearch_client_key: /path/to/your/client.key

    # If you need to provide a CA certificate for your Elasticsarech instance, put
    # the path of the pem file here.
    # ca: /path/to/your/CA.pem

    # The default application to load.
    default_app_id: "discover"

    # Time in milliseconds to wait for elasticsearch to respond to pings, defaults to
    # request_timeout setting
    # ping_timeout: 1500

    # Time in milliseconds to wait for responses from the back end or elasticsearch.
    # This must be > 0
    request_timeout: 300000

    # Time in milliseconds for Elasticsearch to wait for responses from shards.
    # Set to 0 to disable.
    shard_timeout: 0

    # Time in milliseconds to wait for Elasticsearch at Kibana startup before retrying
    # startup_timeout: 5000

    # Set to false to have a complete disregard for the validity of the SSL
    # certificate.
    verify_ssl: true

    # SSL for outgoing requests from the Kibana Server (PEM formatted)
    # ssl_key_file: /path/to/your/server.key
    # ssl_cert_file: /path/to/your/server.crt

    # Set the path to where you would like the process id file to be created.
    # pid_file: /var/run/kibana.pid

    # If you would like to send the log output to a file you can set the path below.
    # This will also turn off the STDOUT log output.
    # log_file: ./kibana.log

    # Plugins that are included in the build, and no longer found in the plugins/ folder
    bundled_plugin_ids:
    - plugins/dashboard/index
    - plugins/discover/index
    - plugins/doc/index
    - plugins/kibana/index
    - plugins/markdown_vis/index
    - plugins/metric_vis/index
    - plugins/settings/index
    - plugins/table_vis/index
    - plugins/vis_types/index
    - plugins/visualize/index

    JVM调优

    #修改elasticsearch.in.sh
    vi /usr/share/elasticsearch/bin/elasticsearch.in.sh
    
    if [ "x$ES_MIN_MEM" = "x" ]; then
        ES_MIN_MEM=1g
    fi
    if [ "x$ES_MAX_MEM" = "x" ]; then
        ES_MAX_MEM=1g
  • 相关阅读:
    sql 数据库 初级 个人学习总结(一)
    parentViewController
    关于iOS9之后的loadViewIfNeeded
    判断版本号
    MagicalRecord(简化CoreData操作)
    coreData
    PureLayout(轻量级自动布局)
    MJRefresh(上拉加载下拉刷新)
    MJExtension(JSON到数据模型的自动转换)
    BaceModel
  • 原文地址:https://www.cnblogs.com/davidwang456/p/5238973.html
Copyright © 2020-2023  润新知