Trace跟踪参数
- -verbose:gc
- -XX:+printGC
- 可以打印GC的简要信息
- [GC 4790K->374K(15872K), 0.0001606 secs]
- [GC 4790K->374K(15872K), 0.0001474 secs]
- [GC 4790K->374K(15872K), 0.0001563 secs]
- [GC 4790K->374K(15872K), 0.0001682 secs]
- -XX:+PrintGCDetails
- 打印GC详细信息
- -XX:+PrintGCTimeStamps
- 打印CG发生的时间戳
- 例
- [GC[DefNew: 4416K->0K(4928K), 0.0001897 secs] 4790K->374K(15872K), 0.0002232 secs] [Times: user=0.00 sys=0.00, real=0.00 secs]
- -XX:+PrintGCDetails的输出
- Heap
- def new generation total 13824K, used 11223K [0x27e80000, 0x28d80000, 0x28d80000)
- eden space 12288K, 91% used [0x27e80000, 0x28975f20, 0x28a80000)
- from space 1536K, 0% used [0x28a80000, 0x28a80000, 0x28c00000)
- to space 1536K, 0% used [0x28c00000, 0x28c00000, 0x28d80000)
- tenured generation total 5120K, used 0K [0x28d80000, 0x29280000, 0x34680000)
- the space 5120K, 0% used [0x28d80000, 0x28d80000, 0x28d80200, 0x29280000)
- compacting perm gen total 12288K, used 142K [0x34680000, 0x35280000, 0x38680000)
- the space 12288K, 1% used [0x34680000, 0x346a3a90, 0x346a3c00, 0x35280000)
- ro space 10240K, 44% used [0x38680000, 0x38af73f0, 0x38af7400, 0x39080000)
- rw space 12288K, 52% used [0x39080000, 0x396cdd28, 0x396cde00, 0x39c80000)
- -Xloggc:log/gc.log
- 指定GC log的位置,以文件输出
- 帮助开发人员分析问题

- -XX:+PrintHeapAtGC
- 每次一次GC后,都打印堆信息
{Heap before GC invocations=0 (full 0):
def new generation total 3072K, used 2752K [0x33c80000, 0x33fd0000, 0x33fd0000)
eden space 2752K, 100% used [0x33c80000, 0x33f30000, 0x33f30000)
from space 320K, 0% used [0x33f30000, 0x33f30000, 0x33f80000)
to space 320K, 0% used [0x33f80000, 0x33f80000, 0x33fd0000)
tenured generation total 6848K, used 0K [0x33fd0000, 0x34680000, 0x34680000)
the space 6848K, 0% used [0x33fd0000, 0x33fd0000, 0x33fd0200, 0x34680000)
compacting perm gen total 12288K, used 143K [0x34680000, 0x35280000, 0x38680000)
the space 12288K, 1% used [0x34680000, 0x346a3c58, 0x346a3e00, 0x35280000)
ro space 10240K, 44% used [0x38680000, 0x38af73f0, 0x38af7400, 0x39080000)
rw space 12288K, 52% used [0x39080000, 0x396cdd28, 0x396cde00, 0x39c80000)
[GC[DefNew: 2752K->320K(3072K), 0.0014296 secs] 2752K->377K(9920K), 0.0014604 secs] [Times: user=0.00 sys=0.00, real=0.00 secs]
Heap after GC invocations=1 (full 0):
def new generation total 3072K, used 320K [0x33c80000, 0x33fd0000, 0x33fd0000)
eden space 2752K, 0% used [0x33c80000, 0x33c80000, 0x33f30000)
from space 320K, 100% used [0x33f80000, 0x33fd0000, 0x33fd0000)
to space 320K, 0% used [0x33f30000, 0x33f30000, 0x33f80000)
tenured generation total 6848K, used 57K [0x33fd0000, 0x34680000, 0x34680000)
the space 6848K, 0% used [0x33fd0000, 0x33fde458, 0x33fde600, 0x34680000)
compacting perm gen total 12288K, used 143K [0x34680000, 0x35280000, 0x38680000)
the space 12288K, 1% used [0x34680000, 0x346a3c58, 0x346a3e00, 0x35280000)
ro space 10240K, 44% used [0x38680000, 0x38af73f0, 0x38af7400, 0x39080000)
rw space 12288K, 52% used [0x39080000, 0x396cdd28, 0x396cde00, 0x39c80000)
}
- -XX:+TraceClassLoading
- 监控类的加载
- [Loaded java.lang.Object from shared objects file]
- [Loaded java.io.Serializable from shared objects file]
- [Loaded java.lang.Comparable from shared objects file]
- [Loaded java.lang.CharSequence from shared objects file]
- [Loaded java.lang.String from shared objects file]
- [Loaded java.lang.reflect.GenericDeclaration from shared objects file]
- [Loaded java.lang.reflect.Type from shared objects file]
- -XX:+PrintClassHistogram
- 按下Ctrl+Break后,打印类的信息:
-
num #instances #bytes class name
----------------------------------------------
1: 890617 470266000 [B
2: 890643 21375432 java.util.HashMap$Node
3: 890608 14249728 java.lang.Long
4: 13 8389712 [Ljava.util.HashMap$Node;
5: 2062 371680 [C
6: 463 41904 java.lang.Class - 分别显示:序号、实例数量、总大小、类型
- -Xmx –Xms
- 指定最大堆和最小堆
- -Xmx20m -Xms5m 运行代码:
- System.out.print("Xmx=");
- System.out.println(Runtime.getRuntime().maxMemory()/1024.0/1024+"M");
- System.out.print("free mem=");
- System.out.println(Runtime.getRuntime().freeMemory()/1024.0/1024+"M");
- System.out.print("total mem=");
- System.out.println(Runtime.getRuntime().totalMemory()/1024.0/1024+"M");
Xmx=19.375M
free mem=4.342750549316406M
total mem=4.875M
- -Xmx20m -Xms5m 运行代码
- byte[] b=new byte[1*1024*1024];
- System.out.println("分配了1M空间给数组");
- System.out.print("Xmx=");
- System.out.println(Runtime.getRuntime().maxMemory()/1024.0/1024+"M");
- System.out.print("free mem=");
- System.out.println(Runtime.getRuntime().freeMemory()/1024.0/1024+"M");
- System.out.print("total mem=");
- System.out.println(Runtime.getRuntime().totalMemory()/1024.0/1024+"M");
-
分配了1M空间给数组
Xmx=19.375M
free mem=3.4791183471679688M
total mem=4.875M - Java会尽可能维持在最小堆
-
- -Xmx20m -Xms5m 运行代码
- b=new byte[4*1024*1024];
- System.out.println("分配了4M空间给数组");
- System.out.print("Xmx=");
- System.out.println(Runtime.getRuntime().maxMemory()/1024.0/1024+"M");
- System.out.print("free mem=");
- System.out.println(Runtime.getRuntime().freeMemory()/1024.0/1024+"M");
- System.out.print("total mem=");
- System.out.println(Runtime.getRuntime().totalMemory()/1024.0/1024+"M");
-
分配了4M空间给数组
Xmx=19.375M
free mem=3.5899810791015625M
total mem=9.00390625M 
- -Xmx20m -Xms5m 运行代码
-
- System.gc();
- System.out.println("回收内存");
- System.out.print("Xmx=");
- System.out.println(Runtime.getRuntime().maxMemory()/1024.0/1024+"M");
- System.out.print("free mem=");
- System.out.println(Runtime.getRuntime().freeMemory()/1024.0/1024+"M");
- System.out.print("total mem=");
- System.out.println(Runtime.getRuntime().totalMemory()/1024.0/1024+"M");
-
回收内存
Xmx=19.375M
free mem=6.354591369628906M
total mem=10.75390625M
-
- -Xmn
- 设置新生代大小
- -XX:NewRatio
- 新生代(eden+2*s)和老年代(不包含永久区)的比值
- 4 表示 新生代:老年代=1:4,即年轻代占堆的1/5
- -XX:SurvivorRatio
- 设置两个Survivor区和eden的比
- 8表示 两个Survivor :eden=2:8,即一个Survivor占年轻代的1/10
-
public static void main(String[] args) {
   byte[] b=null;
   for(int i=0;i<10;i++)
       b=new byte[1*1024*1024];
}
-Xmx20m -Xms20m -Xmn1m -XX:+PrintGCDetails

- 没有触发GC
- 全部分配在老年代
-
-
-Xmx20m -Xms20m -Xmn15m -XX:+PrintGCDetails

- 没有触发GC
- 全部分配在eden
- 老年代没有使用
-
-Xmx20m -Xms20m –Xmn7m -XX:+PrintGCDetails
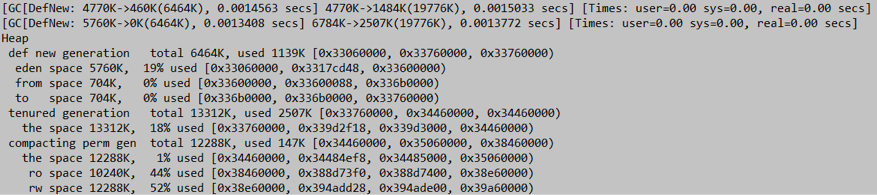
1.进行了2次新生代GC
2.s0 s1 太小需要老年代担保
-
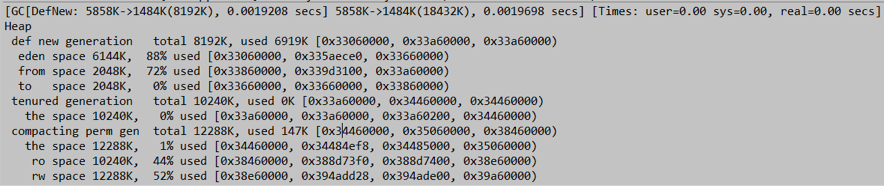
-Xmx20m -Xms20m -Xmn7m -XX:SurvivorRatio=2 -XX:+PrintGCDetails

1.进行了3次新生代GC
2.s0 s1 增大
-
-Xmx20m -Xms20m -XX:NewRatio=1 -XX:SurvivorRatio=2 -XX:+PrintGCDetails

-Xmx20m -Xms20m -XX:NewRatio=1-XX:SurvivorRatio=3 -XX:+PrintGCDetails
-
- -XX:+HeapDumpOnOutOfMemoryError
- OOM时导出堆到文件
- -XX:+HeapDumpPath
- 导出OOM的路径
- -Xmx20m -Xms5m -XX:+HeapDumpOnOutOfMemoryError -XX:HeapDumpPath=d:/a.dump
- Vector v=new Vector();
- for(int i=0;i<25;i++)
- v.add(new byte[1*1024*1024]);
- -XX:OnOutOfMemoryError
- 在OOM时,执行一个脚本
- "-XX:OnOutOfMemoryError=D:/tools/jdk1.7_40/bin/printstack.bat %p“
- 当程序OOM时,在D:/a.txt中将会生成线程的dump
- 可以在OOM时,发送邮件,甚至是重启程序
- 根据实际事情调整新生代和幸存代的大小
- 官方推荐新生代占堆的3/8
- 幸存代占新生代的1/10
- 在OOM时,记得Dump出堆,确保可以排查现场问题
永久区分配参数
- -XX:PermSize -XX:MaxPermSize
- 设置永久区的初始空间和最大空间
- 他们表示,一个系统可以容纳多少个类型
栈大小分配
- -Xss
- 通常只有几百K
- 决定了函数调用的深度
- 每个线程都有独立的栈空间
- 局部变量、参数 分配在栈上
-
public class TestStackDeep {
    private static int count=0;
    public static void recursion(long a,long b,long c){
        long e=1,f=2,g=3,h=4,i=5,k=6,q=7,x=8,y=9,z=10;
        count++;
        recursion(a,b,c);
    }
    public static void main(String args[]){
        try{
            recursion(0L,0L,0L);
        }catch(Throwable e){
            System.out.println("deep of calling = "+count);
            e.printStackTrace();
        }
    }
}
递归调用
-Xss128K
deep of calling = 701
java.lang.StackOverflowError
-Xss256K
deep of calling = 1817
java.lang.StackOverflowError