可视化UI界面Grafana的安装和配置
Grafana介绍
Grafana是一个跨平台的开源的度量分析和可视化工具,可以将采集的数据可视化的展示,并及时通知给告警接收方。它主要有以下六大特点:
1、展示方式:快速灵活的客户端图表,面板插件有许多不同方式的可视化指标和日志,官方库中具有丰富的仪表盘插件,比如热图、折线图、图表等多种展示方式;
2、数据源:Graphite,InfluxDB,OpenTSDB,Prometheus,Elasticsearch,CloudWatch和KairosDB等;
3、通知提醒:以可视方式定义最重要指标的警报规则,Grafana将不断计算并发送通知,在数据达到阈值时通过Slack、PagerDuty等获得通知;
4、混合展示:在同一图表中混合使用不同的数据源,可以基于每个查询指定数据源,甚至自定义数据源;
5、注释:使用来自不同数据源的丰富事件注释图表,将鼠标悬停在事件上会显示完整的事件元数据和标记。
安装Grafana
安装Grafana需要的镜像heapster-grafana-amd64_v5_0_4.tar.gz,把镜像上传到k8s的工作节点xianchaonode1上,手动解压:
[root@xianchaonode1 ~]# docker load -i heapster-grafana-amd64_v5_0_4.tar.gz
grafana.yaml文件在课件里,可上传到k8s的控制节点:

更新yaml文件:
[root@xianchaomaster1 prometheus]# kubectl apply -f grafana.yaml

#查看grafana是否创建成功:
[root@xianchaomaster1 prometheus]# kubectl get pods -n kube-system -l task=monitoring

显示如下,说明部署成功
NAME                                  READY   STATUS    RESTARTS   AGE
monitoring-grafana-675798bf47-cw9hr   1/1     Running   0          39s


apiVersion: apps/v1
kind: Deployment
metadata:
  name: monitoring-grafana
  namespace: kube-system
spec:
  replicas: 1
  selector:
    matchLabels:
      task: monitoring
      k8s-app: grafana
  template:
    metadata:
      labels:
        task: monitoring
apiVersion: apps/v1
kind: Deployment
metadata:
  name: monitoring-grafana
  namespace: kube-system
spec:
  replicas: 1
  selector:
    matchLabels:
      task: monitoring
      k8s-app: grafana
  template:
    metadata:
      labels:
        task: monitoring
        k8s-app: grafana
    spec:
      containers:
      - name: grafana
        image: 172.17.166.217/kubenetes/heapster-grafana-amd64:v5.0.4
        ports:
        - containerPort: 3000
          protocol: TCP
        volumeMounts:
        - mountPath: /etc/ssl/certs
          name: ca-certificates
          readOnly: true
        - mountPath: /var
          name: grafana-storage
        env:
        - name: INFLUXDB_HOST
          value: monitoring-influxdb
        - name: GF_SERVER_HTTP_PORT
          value: "3000"
          # The following env variables are required to make Grafana accessible via
          # the kubernetes api-server proxy. On production clusters, we recommend
          # removing these env variables, setup auth for grafana, and expose the grafana
          # service using a LoadBalancer or a public IP.
        - name: GF_AUTH_BASIC_ENABLED
          value: "false"
        - name: GF_AUTH_ANONYMOUS_ENABLED
          value: "true"
        - name: GF_AUTH_ANONYMOUS_ORG_ROLE
          value: Admin
        - name: GF_SERVER_ROOT_URL
          # If you're only using the API Server proxy, set this value instead:
          # value: /api/v1/namespaces/kube-system/services/monitoring-grafana/proxy
          value: /
      volumes:
      - name: ca-certificates
        hostPath:
          path: /etc/ssl/certs
      - name: grafana-storage
        emptyDir: {}
---
apiVersion: v1
kind: Service
metadata:
  labels:
    # For use as a Cluster add-on (https://github.com/kubernetes/kubernetes/tree/master/cluster/addons)
    # If you are NOT using this as an addon, you should comment out this line.
    kubernetes.io/cluster-service: 'true'
    kubernetes.io/name: monitoring-grafana
  name: monitoring-grafana
  namespace: kube-system
spec:
  # In a production setup, we recommend accessing Grafana through an external Loadbalancer
  # or through a public IP.
  # type: LoadBalancer
  # You could also use NodePort to expose the service at a randomly-generated port
  # type: NodePort
  ports:
  - port: 80
    targetPort: 3000
  selector:
    k8s-app: grafana
  type: ClusterIP
Grafana界面接入Prometheus数据源
查看grafana前端的service
[root@xianchaomaster1]# kubectl get svc -n kube-system | grep grafana
显示如下:
monitoring-grafana NodePort 10.106.3.47 <none> 80:30858/TCP
1)登陆grafana,在浏览器访问
192.168.40.180:30858
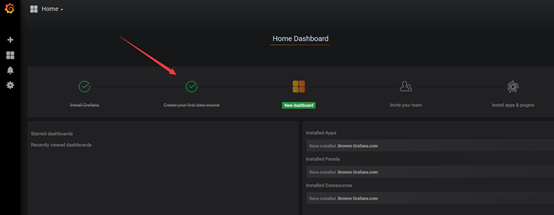
可看到如下界面:

2)配置grafana界面:
开始配置grafana的web界面:
选择Create your first data source
出现如下
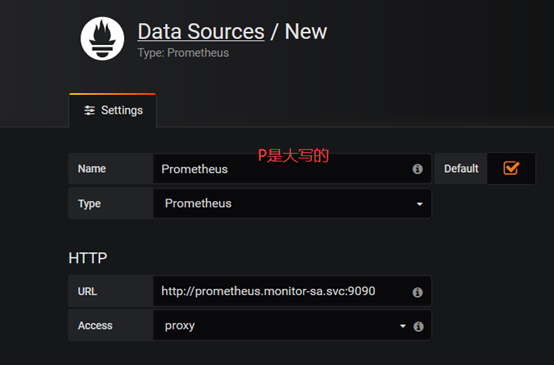
Name: Prometheus
Type: Prometheus
HTTP 处的URL写 如下:
http://prometheus.monitor-sa.svc:9090
配置好的整体页面如下:
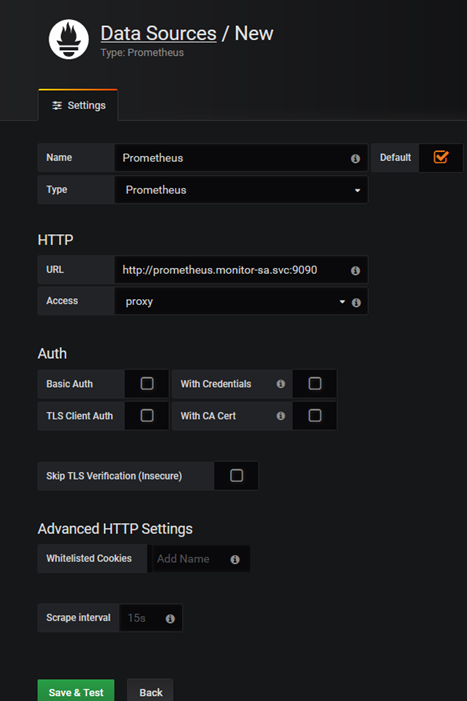
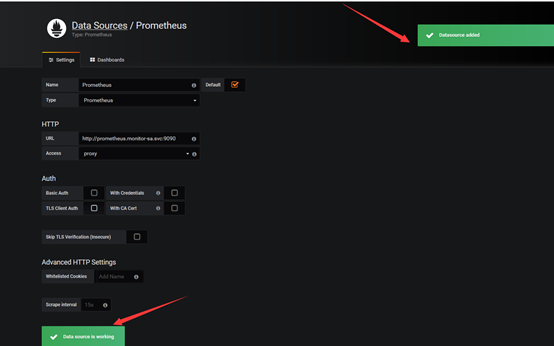
点击左下角Save & Test,出现如下Data source is working,说明prometheus数据源成功的被grafana接入了
导入的监控模板,可在如下链接搜索
https://grafana.com/dashboards?dataSource=prometheus&search=kubernetes
可直接导入node_exporter.json监控模板,这个可以把node节点指标显示出来
node_exporter.json在课件里
可直接导入docker_rev1.json,显示容器资源指标的,docker_rev1.json在课件里
怎么导入监控模板,按如下步骤:
上面Save & Test测试没问题之后,就可以返回Grafana主页面
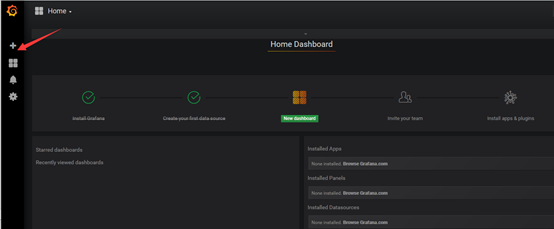
点击左侧+号下面的Import,出现如下界面

选择Upload json file,出现如下
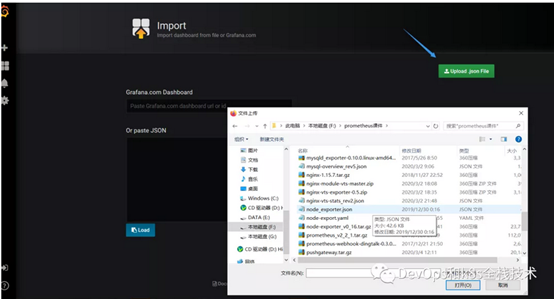
选择一个本地的json文件,我们选择的是上面让大家下载的node_exporter.json这个文件,选择之后出现如下:
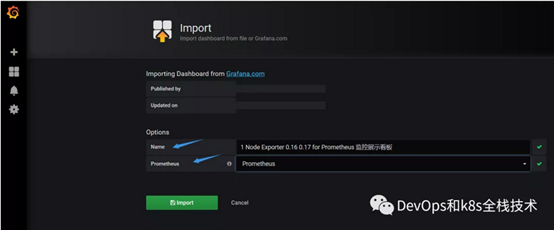
注:箭头标注的地方Name后面的名字是node_exporter.json定义的
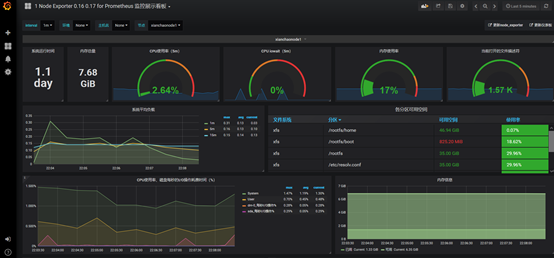
Prometheus后面需要变成Prometheus,然后再点击Import,就可以出现如下界面:
{ "__inputs": [ { "name": "DS_PROMETHEUS", "label": "Prometheus", "description": "", "type": "datasource", "pluginId": "prometheus", "pluginName": "Prometheus" } ], "__requires": [ { "type": "grafana", "id": "grafana", "name": "Grafana", "version": "v5.0.4" }, { "type": "panel", "id": "graph", "name": "Graph", "version": "5.0.0" }, { "type": "datasource", "id": "prometheus", "name": "Prometheus", "version": "5.0.0" }, { "type": "panel", "id": "singlestat", "name": "Singlestat", "version": "5.0.0" }, { "type": "panel", "id": "table", "name": "Table", "version": "5.0.0" }, { "type": "panel", "id": "text", "name": "Text", "version": "5.0.0" } ], "annotations": { "list": [ { "builtIn": 1, "datasource": "-- Grafana --", "enable": true, "hide": true, "iconColor": "rgba(0, 211, 255, 1)", "name": "Annotations & Alerts", "type": "dashboard" } ] }, "description": "使用 Node Exporter v0.16 0.17,精简优化重要指标展示。包含:CPU 内存 磁盘 IO 网络 温度等监控指标。https://github.com/starsliao/Prometheus", "editable": true, "gnetId": 8919, "graphTooltip": 0, "id": null, "iteration": 1577635529131, "links": [ { "icon": "external link", "tags": [], "targetBlank": true, "title": "更新node_exporter", "tooltip": "", "type": "link", "url": "https://github.com/prometheus/node_exporter/releases" }, { "icon": "external link", "tags": [], "targetBlank": true, "title": "更新仪表板", "tooltip": "", "type": "link", "url": "https://grafana.com/dashboards/8919" } ], "panels": [ { "content": "", "editable": true, "error": false, "gridPos": { "h": 1, "w": 24, "x": 0, "y": 0 }, "id": 11, "links": [], "minSpan": 4, "mode": "html", "repeat": "node", "repeatDirection": "h", "style": {}, "title": "$node", "type": "text" }, { "cacheTimeout": null, "colorBackground": false, "colorValue": false, "colors": [ "rgba(245, 54, 54, 0.9)", "rgba(237, 129, 40, 0.89)", "rgba(50, 172, 45, 0.97)" ], "datasource": "${DS_PROMETHEUS}", "decimals": 1, "description": "", "format": "s", "gauge": { "maxValue": 100, "minValue": 0, "show": false, "thresholdLabels": false, "thresholdMarkers": true }, "gridPos": { "h": 5, "w": 2, "x": 0, "y": 2 }, "hideTimeOverride": true, "id": 15, "interval": null, "links": [], "mappingType": 1, "mappingTypes": [ { "name": "value to text", "value": 1 }, { "name": "range to text", "value": 2 } ], "maxDataPoints": 100, "nullPointMode": "null", "nullText": null, "postfix": "", "postfixFontSize": "50%", "prefix": "", "prefixFontSize": "50%", "rangeMaps": [ { "from": "null", "text": "N/A", "to": "null" } ], "sparkline": { "fillColor": "rgba(31, 118, 189, 0.18)", "full": false, "lineColor": "rgb(31, 120, 193)", "show": false }, "tableColumn": "", "targets": [ { "expr": "time() - node_boot_time_seconds{instance=~"$node"}", "format": "time_series", "hide": false, "instant": true, "intervalFactor": 2, "refId": "A", "step": 40 } ], "thresholds": "", "title": "系统运行时间", "transparent": false, "type": "singlestat", "valueFontSize": "100%", "valueMaps": [ { "op": "=", "text": "N/A", "value": "null" } ], "valueName": "current" }, { "cacheTimeout": null, "colorBackground": false, "colorValue": false, "colors": [ "rgba(245, 54, 54, 0.9)", "rgba(237, 129, 40, 0.89)", "rgba(50, 172, 45, 0.97)" ], "datasource": "${DS_PROMETHEUS}", "decimals": null, "description": "", "format": "bytes", "gauge": { "maxValue": 100, "minValue": 0, "show": false, "thresholdLabels": false, "thresholdMarkers": true }, "gridPos": { "h": 5, "w": 2, "x": 2, "y": 2 }, "id": 75, "interval": null, "links": [], "mappingType": 1, "mappingTypes": [ { "name": "value to text", "value": 1 }, { "name": "range to text", "value": 2 } ], "maxDataPoints": 100, "minSpan": 4, "nullPointMode": "null", "nullText": null, "postfix": "", "postfixFontSize": "70%", "prefix": "", "prefixFontSize": "50%", "rangeMaps": [ { "from": "null", "text": "N/A", "to": "null" } ], "sparkline": { "fillColor": "rgba(31, 118, 189, 0.18)", "full": false, "lineColor": "rgb(31, 120, 193)", "show": false }, "tableColumn": "", "targets": [ { "expr": "node_memory_MemTotal_bytes{instance=~"$node"}", "format": "time_series", "instant": true, "intervalFactor": 1, "legendFormat": "{{instance}}", "refId": "A", "step": 20 } ], "thresholds": "", "title": "内存总量", "type": "singlestat", "valueFontSize": "80%", "valueMaps": [ { "op": "=", "text": "N/A", "value": "null" } ], "valueName": "current" }, { "cacheTimeout": null, "colorBackground": false, "colorValue": true, "colors": [ "rgba(50, 172, 45, 0.97)", "rgba(237, 129, 40, 0.89)", "rgba(245, 54, 54, 0.9)" ], "datasource": "${DS_PROMETHEUS}", "decimals": 2, "description": "", "format": "percent", "gauge": { "maxValue": 100, "minValue": 0, "show": true, "thresholdLabels": false, "thresholdMarkers": true }, "gridPos": { "h": 5, "w": 5, "x": 4, "y": 2 }, "id": 167, "interval": null, "links": [], "mappingType": 1, "mappingTypes": [ { "name": "value to text", "value": 1 }, { "name": "range to text", "value": 2 } ], "maxDataPoints": 100, "minSpan": 2, "nullPointMode": "null", "nullText": null, "postfix": "", "postfixFontSize": "50%", "prefix": "", "prefixFontSize": "50%", "rangeMaps": [ { "from": "null", "text": "N/A", "to": "null" } ], "sparkline": { "fillColor": "rgba(31, 118, 189, 0.18)", "full": false, "lineColor": "rgb(31, 120, 193)", "show": true }, "tableColumn": "", "targets": [ { "expr": "100 - (avg(irate(node_cpu_seconds_total{instance=~"$node",mode="idle"}[5m])) * 100)", "format": "time_series", "hide": false, "interval": "", "intervalFactor": 1, "legendFormat": "", "refId": "A", "step": 20 } ], "thresholds": "50,80", "title": "CPU使用率(5m)", "type": "singlestat", "valueFontSize": "80%", "valueMaps": [ { "op": "=", "text": "N/A", "value": "null" } ], "valueName": "current" }, { "cacheTimeout": null, "colorBackground": false, "colorValue": true, "colors": [ "rgba(50, 172, 45, 0.97)", "rgba(237, 129, 40, 0.89)", "rgba(245, 54, 54, 0.9)" ], "datasource": "${DS_PROMETHEUS}", "decimals": 2, "description": "", "format": "percent", "gauge": { "maxValue": 100, "minValue": 0, "show": true, "thresholdLabels": false, "thresholdMarkers": true }, "gridPos": { "h": 5, "w": 5, "x": 9, "y": 2 }, "id": 20, "interval": null, "links": [], "mappingType": 1, "mappingTypes": [ { "name": "value to text", "value": 1 }, { "name": "range to text", "value": 2 } ], "maxDataPoints": 100, "minSpan": 2, "nullPointMode": "null", "nullText": null, "postfix": "", "postfixFontSize": "50%", "prefix": "", "prefixFontSize": "50%", "rangeMaps": [ { "from": "null", "text": "N/A", "to": "null" } ], "sparkline": { "fillColor": "rgba(31, 118, 189, 0.18)", "full": false, "lineColor": "rgb(31, 120, 193)", "show": true }, "tableColumn": "", "targets": [ { "expr": "avg(irate(node_cpu_seconds_total{instance=~"$node",mode="iowait"}[5m])) * 100", "format": "time_series", "hide": false, "interval": "", "intervalFactor": 1, "legendFormat": "", "refId": "A", "step": 20 } ], "thresholds": "20,50", "title": "CPU iowait(5m)", "type": "singlestat", "valueFontSize": "80%", "valueMaps": [ { "op": "=", "text": "N/A", "value": "null" } ], "valueName": "current" }, { "cacheTimeout": null, "colorBackground": false, "colorValue": true, "colors": [ "rgba(50, 172, 45, 0.97)", "rgba(237, 129, 40, 0.89)", "rgba(245, 54, 54, 0.9)" ], "datasource": "${DS_PROMETHEUS}", "decimals": 0, "description": "", "format": "percent", "gauge": { "maxValue": 100, "minValue": 0, "show": true, "thresholdLabels": false, "thresholdMarkers": true }, "gridPos": { "h": 5, "w": 5, "x": 14, "y": 2 }, "hideTimeOverride": false, "id": 172, "interval": null, "links": [], "mappingType": 1, "mappingTypes": [ { "name": "value to text", "value": 1 }, { "name": "range to text", "value": 2 } ], "maxDataPoints": 100, "minSpan": 4, "nullPointMode": "null", "nullText": null, "postfix": "", "postfixFontSize": "50%", "prefix": "", "prefixFontSize": "50%", "rangeMaps": [ { "from": "null", "text": "N/A", "to": "null" } ], "sparkline": { "fillColor": "rgba(31, 118, 189, 0.18)", "full": false, "lineColor": "rgb(31, 120, 193)", "show": true }, "tableColumn": "", "targets": [ { "expr": "(1 - (node_memory_MemAvailable_bytes{instance=~"$node"} / (node_memory_MemTotal_bytes{instance=~"$node"})))* 100", "format": "time_series", "hide": false, "interval": "10s", "intervalFactor": 1, "refId": "A", "step": 20 } ], "thresholds": "80,90", "title": "内存使用率", "type": "singlestat", "valueFontSize": "80%", "valueMaps": [], "valueName": "current" }, { "cacheTimeout": null, "colorBackground": false, "colorPostfix": false, "colorPrefix": false, "colorValue": true, "colors": [ "rgba(50, 172, 45, 0.97)", "rgba(237, 129, 40, 0.89)", "rgba(245, 54, 54, 0.9)" ], "datasource": "${DS_PROMETHEUS}", "decimals": 2, "description": "", "format": "short", "gauge": { "maxValue": 10000, "minValue": null, "show": true, "thresholdLabels": false, "thresholdMarkers": true }, "gridPos": { "h": 5, "w": 5, "x": 19, "y": 2 }, "hideTimeOverride": false, "id": 16, "interval": null, "links": [], "mappingType": 1, "mappingTypes": [ { "name": "value to text", "value": 1 }, { "name": "range to text", "value": 2 } ], "maxDataPoints": 100, "minSpan": 4, "nullPointMode": "null", "nullText": null, "postfix": "", "postfixFontSize": "50%", "prefix": "", "prefixFontSize": "50%", "rangeMaps": [ { "from": "null", "text": "N/A", "to": "null" } ], "sparkline": { "fillColor": "rgba(31, 118, 189, 0.18)", "full": false, "lineColor": "rgb(31, 120, 193)", "show": true }, "tableColumn": "", "targets": [ { "expr": "node_filefd_allocated{instance=~"$node"}", "format": "time_series", "instant": false, "interval": "10s", "intervalFactor": 1, "refId": "B" } ], "thresholds": "7000,9000", "title": "当前打开的文件描述符", "transparent": false, "type": "singlestat", "valueFontSize": "70%", "valueMaps": [], "valueName": "current" }, { "aliasColors": { "15分钟": "#6ED0E0", "1分钟": "#BF1B00", "5分钟": "#CCA300" }, "bars": false, "dashLength": 10, "dashes": false, "datasource": "${DS_PROMETHEUS}", "editable": true, "error": false, "fill": 1, "grid": {}, "gridPos": { "h": 6, "w": 11, "x": 0, "y": 7 }, "height": "300", "id": 13, "legend": { "alignAsTable": true, "avg": true, "current": true, "max": true, "min": false, "rightSide": true, "show": true, "total": false, "values": true }, "lines": true, "linewidth": 2, "links": [], "minSpan": 4, "nullPointMode": "null as zero", "percentage": false, "pointradius": 5, "points": false, "renderer": "flot", "repeat": null, "seriesOverrides": [], "spaceLength": 10, "stack": false, "steppedLine": false, "targets": [ { "expr": "node_load1{instance=~"$node"}", "format": "time_series", "instant": false, "interval": "10s", "intervalFactor": 2, "legendFormat": "1m", "metric": "", "refId": "A", "step": 20, "target": "" }, { "expr": "node_load5{instance=~"$node"}", "format": "time_series", "instant": false, "interval": "10s", "intervalFactor": 2, "legendFormat": "5m", "refId": "B", "step": 20 }, { "expr": "node_load15{instance=~"$node"}", "format": "time_series", "instant": false, "interval": "10s", "intervalFactor": 2, "legendFormat": "15m", "refId": "C", "step": 20 } ], "thresholds": [], "timeFrom": null, "timeRegions": [], "timeShift": null, "title": "系统平均负载", "tooltip": { "msResolution": false, "shared": true, "sort": 0, "value_type": "cumulative" }, "type": "graph", "xaxis": { "buckets": null, "mode": "time", "name": null, "show": true, "values": [] }, "yaxes": [ { "format": "short", "logBase": 1, "max": null, "min": null, "show": true }, { "format": "short", "logBase": 1, "max": null, "min": null, "show": true } ], "yaxis": { "align": false, "alignLevel": null } }, { "columns": [], "datasource": "${DS_PROMETHEUS}", "fontSize": "120%", "gridPos": { "h": 6, "w": 13, "x": 11, "y": 7 }, "id": 164, "links": [], "pageSize": null, "scroll": true, "showHeader": true, "sort": { "col": 11, "desc": true }, "styles": [ { "alias": "Time", "dateFormat": "YYYY-MM-DD HH:mm:ss", "pattern": "Time", "type": "hidden" }, { "alias": "分区", "colorMode": null, "colors": [ "rgba(50, 172, 45, 0.97)", "rgba(237, 129, 40, 0.89)", "rgba(245, 54, 54, 0.9)" ], "dateFormat": "YYYY-MM-DD HH:mm:ss", "decimals": 2, "mappingType": 1, "pattern": "mountpoint", "thresholds": [ "" ], "type": "string", "unit": "bytes" }, { "alias": "可用空间", "colorMode": "value", "colors": [ "rgba(245, 54, 54, 0.9)", "rgba(237, 129, 40, 0.89)", "rgba(50, 172, 45, 0.97)" ], "dateFormat": "YYYY-MM-DD HH:mm:ss", "decimals": 2, "mappingType": 1, "pattern": "Value #A", "thresholds": [ "10000000000", "20000000000" ], "type": "number", "unit": "bytes" }, { "alias": "使用率", "colorMode": "cell", "colors": [ "rgba(50, 172, 45, 0.97)", "rgba(237, 129, 40, 0.89)", "rgba(245, 54, 54, 0.9)" ], "dateFormat": "YYYY-MM-DD HH:mm:ss", "decimals": 2, "mappingType": 1, "pattern": "Value #B", "thresholds": [ "70", "90" ], "type": "number", "unit": "percentunit" }, { "alias": "总空间", "colorMode": null, "colors": [ "rgba(245, 54, 54, 0.9)", "rgba(237, 129, 40, 0.89)", "rgba(50, 172, 45, 0.97)" ], "dateFormat": "YYYY-MM-DD HH:mm:ss", "decimals": 1, "link": false, "mappingType": 1, "pattern": "Value #C", "thresholds": [], "type": "number", "unit": "bytes" }, { "alias": "文件系统", "colorMode": null, "colors": [ "rgba(245, 54, 54, 0.9)", "rgba(237, 129, 40, 0.89)", "rgba(50, 172, 45, 0.97)" ], "dateFormat": "YYYY-MM-DD HH:mm:ss", "decimals": 2, "link": false, "mappingType": 1, "pattern": "fstype", "thresholds": [], "type": "number", "unit": "short" }, { "alias": "", "colorMode": null, "colors": [ "rgba(245, 54, 54, 0.9)", "rgba(237, 129, 40, 0.89)", "rgba(50, 172, 45, 0.97)" ], "decimals": 2, "pattern": "/.*/", "preserveFormat": true, "sanitize": false, "thresholds": [], "type": "hidden", "unit": "short" } ], "targets": [ { "expr": "node_filesystem_size{instance=~'$node',fstype=~"ext4|xfs"}", "format": "table", "hide": true, "instant": true, "intervalFactor": 1, "legendFormat": "", "refId": "C" }, { "expr": "node_filesystem_avail_bytes{instance=~'$node',fstype=~"ext4|xfs"}", "format": "table", "hide": false, "instant": true, "interval": "10s", "intervalFactor": 1, "legendFormat": "", "refId": "A" }, { "expr": "1-(node_filesystem_free_bytes{instance=~'$node',fstype=~"ext4|xfs"} / node_filesystem_size_bytes{instance=~'$node',fstype=~"ext4|xfs"})", "format": "table", "hide": false, "instant": true, "intervalFactor": 1, "legendFormat": "", "refId": "B" }, { "expr": "", "format": "table", "interval": "10s", "intervalFactor": 1, "legendFormat": "", "refId": "D" } ], "title": "各分区可用空间", "transform": "table", "transparent": false, "type": "table" }, { "aliasColors": { "Idle - Waiting for something to happen": "#052B51", "guest": "#9AC48A", "idle": "#052B51", "iowait": "#EAB839", "irq": "#BF1B00", "nice": "#C15C17", "sdb_每秒I/O操作%": "#d683ce", "softirq": "#E24D42", "steal": "#FCE2DE", "system": "#508642", "user": "#5195CE", "磁盘花费在I/O操作占比": "#ba43a9" }, "bars": false, "dashLength": 10, "dashes": false, "datasource": "${DS_PROMETHEUS}", "decimals": 2, "description": "node_disk_io_time_seconds_total: 磁盘花费在输入/输出操作上的毫秒数。该值为累加值。(Milliseconds Spent Doing I/Os) irate(node_disk_io_time_seconds_total[1m]): 计算每秒的速率:(last值-last前一个值)/时间戳差值,即:1秒钟内磁盘花费在I/O操作的时间占比。", "fill": 1, "gridPos": { "h": 7, "w": 14, "x": 0, "y": 13 }, "id": 7, "legend": { "alignAsTable": true, "avg": true, "current": true, "hideEmpty": true, "hideZero": true, "max": true, "min": false, "rightSide": true, "show": true, "sideWidth": null, "sort": null, "sortDesc": null, "total": false, "values": true }, "lines": true, "linewidth": 1, "links": [], "minSpan": 4, "nullPointMode": "null", "percentage": false, "pointradius": 5, "points": false, "renderer": "flot", "repeat": null, "seriesOverrides": [], "spaceLength": 10, "stack": false, "steppedLine": false, "targets": [ { "expr": "avg(irate(node_cpu_seconds_total{instance=~"$node",mode="system"}[1m]))", "format": "time_series", "interval": "", "intervalFactor": 2, "legendFormat": "System", "refId": "A", "step": 20 }, { "expr": "avg(irate(node_cpu_seconds_total{instance=~"$node",mode="user"}[1m]))", "format": "time_series", "intervalFactor": 2, "legendFormat": "User", "refId": "B", "step": 240 }, { "expr": "avg(irate(node_cpu_seconds_total{instance=~"$node",mode="idle"}[1m]))", "format": "time_series", "hide": true, "intervalFactor": 2, "legendFormat": "Idle", "refId": "F", "step": 240 }, { "expr": "avg(irate(node_cpu_seconds_total{instance=~"$node",mode="iowait"}[1m]))", "format": "time_series", "intervalFactor": 2, "legendFormat": "Iowait", "refId": "D", "step": 240 }, { "expr": "irate(node_disk_io_time_seconds_total{instance=~"$node"}[1m])", "format": "time_series", "intervalFactor": 1, "legendFormat": "{{device}}_每秒I/O操作%", "refId": "C" } ], "thresholds": [], "timeFrom": null, "timeRegions": [], "timeShift": null, "title": "CPU使用率、磁盘每秒的I/O操作耗费时间(%)", "tooltip": { "shared": true, "sort": 0, "value_type": "individual" }, "transparent": false, "type": "graph", "xaxis": { "buckets": null, "mode": "time", "name": null, "show": true, "values": [] }, "yaxes": [ { "decimals": null, "format": "percentunit", "label": "", "logBase": 1, "max": null, "min": null, "show": true }, { "format": "short", "label": null, "logBase": 1, "max": null, "min": null, "show": false } ], "yaxis": { "align": false, "alignLevel": null } }, { "aliasColors": { "内存_Avaliable": "#6ED0E0", "内存_Cached": "#EF843C", "内存_Free": "#629E51", "内存_Total": "#6d1f62", "内存_Used": "#eab839", "可用": "#9ac48a", "总内存": "#bf1b00" }, "bars": false, "dashLength": 10, "dashes": false, "datasource": "${DS_PROMETHEUS}", "decimals": 2, "fill": 6, "gridPos": { "h": 7, "w": 10, "x": 14, "y": 13 }, "height": "300", "id": 156, "legend": { "alignAsTable": false, "avg": false, "current": true, "max": false, "min": false, "rightSide": false, "show": true, "total": false, "values": true }, "lines": true, "linewidth": 3, "links": [], "nullPointMode": "null", "percentage": false, "pointradius": 5, "points": false, "renderer": "flot", "seriesOverrides": [], "spaceLength": 10, "stack": false, "steppedLine": false, "targets": [ { "expr": "node_memory_MemTotal_bytes_{instance=~"$node"}", "format": "time_series", "hide": false, "instant": false, "intervalFactor": 2, "legendFormat": "总内存", "refId": "A", "step": 4 }, { "expr": "node_memory_MemTotal_bytes{instance=~"$node"} - node_memory_MemAvailable_bytes{instance=~"$node"}", "format": "time_series", "hide": false, "intervalFactor": 2, "legendFormat": "已用", "refId": "B", "step": 4 }, { "expr": "node_memory_MemFree_bytes{instance=~"$node"}", "format": "time_series", "hide": true, "intervalFactor": 2, "legendFormat": "内存_Free", "refId": "C", "step": 4 }, { "expr": "node_memory_Buffers_bytes{instance=~"$node"}", "format": "time_series", "hide": true, "intervalFactor": 2, "legendFormat": "内存_Buffers", "refId": "D", "step": 4 }, { "expr": "node_memory_Cached_bytes{instance=~"$node"}", "format": "time_series", "hide": true, "intervalFactor": 2, "legendFormat": "内存_Cached", "refId": "E", "step": 4 }, { "expr": "node_memory_MemAvailable_bytes{instance=~"$node"}", "format": "time_series", "hide": false, "interval": "", "intervalFactor": 2, "legendFormat": "可用", "refId": "F", "step": 4 }, { "expr": "node_memory_MemTotal_bytes{instance=~"$node"} - (node_memory_Cached_bytes{instance=~"$node"} + node_memory_Buffers_bytes{instance=~"$node"} + node_memory_MemFree_bytes{instance=~"$node"})", "format": "time_series", "hide": true, "intervalFactor": 1, "refId": "G" } ], "thresholds": [], "timeFrom": null, "timeRegions": [], "timeShift": null, "title": "内存信息", "tooltip": { "shared": true, "sort": 0, "value_type": "individual" }, "type": "graph", "xaxis": { "buckets": null, "mode": "time", "name": null, "show": true, "values": [] }, "yaxes": [ { "format": "bytes", "label": null, "logBase": 1, "max": null, "min": "0", "show": true }, { "format": "short", "label": null, "logBase": 1, "max": null, "min": null, "show": true } ], "yaxis": { "align": false, "alignLevel": null } }, { "aliasColors": { "vda_write": "#6ED0E0" }, "bars": true, "dashLength": 10, "dashes": false, "datasource": "${DS_PROMETHEUS}", "description": "Reads completed: 每个磁盘分区每秒读完成次数 Writes completed: 每个磁盘分区每秒写完成次数 IO now 每个磁盘分区每秒正在处理的输入/输出请求数", "fill": 2, "gridPos": { "h": 8, "w": 11, "x": 0, "y": 20 }, "height": "300", "id": 161, "legend": { "alignAsTable": false, "avg": false, "current": true, "hideEmpty": true, "hideZero": true, "max": true, "min": false, "show": true, "total": false, "values": true }, "lines": false, "linewidth": 1, "links": [], "nullPointMode": "null", "percentage": false, "pointradius": 5, "points": false, "renderer": "flot", "seriesOverrides": [ { "alias": "/.*_读取$/", "transform": "negative-Y" } ], "spaceLength": 10, "stack": false, "steppedLine": false, "targets": [ { "expr": "irate(node_disk_reads_completed_total{instance=~"$node"}[1m])", "format": "time_series", "hide": false, "interval": "", "intervalFactor": 2, "legendFormat": "{{device}}_读取", "refId": "A", "step": 10 }, { "expr": "irate(node_disk_writes_completed_total{instance=~"$node"}[1m])", "format": "time_series", "hide": false, "intervalFactor": 2, "legendFormat": "{{device}}_写入", "refId": "B", "step": 10 }, { "expr": "node_disk_io_now{instance=~"$node"}", "format": "time_series", "hide": true, "interval": "", "intervalFactor": 1, "legendFormat": "{{device}}", "refId": "C" } ], "thresholds": [], "timeFrom": null, "timeRegions": [], "timeShift": null, "title": "磁盘读写速率(IOPS)", "tooltip": { "shared": true, "sort": 0, "value_type": "individual" }, "type": "graph", "xaxis": { "buckets": null, "mode": "time", "name": null, "show": true, "values": [] }, "yaxes": [ { "decimals": null, "format": "iops", "label": "读取(-)/写入(+)I/O ops/sec", "logBase": 1, "max": null, "min": null, "show": true }, { "format": "short", "label": null, "logBase": 1, "max": null, "min": null, "show": true } ], "yaxis": { "align": false, "alignLevel": null } }, { "aliasColors": { "TCP": "#6ED0E0" }, "bars": false, "dashLength": 10, "dashes": false, "datasource": "${DS_PROMETHEUS}", "description": "CurrEstab - 当前状态为 ESTABLISHED 或 CLOSE-WAIT 的 TCP 连接数 ActiveOpens - 已从 CLOSED 状态直接转换到 SYN-SENT 状态的 TCP 平均连接数(1分钟内) PassiveOpens - 已从 LISTEN 状态直接转换到 SYN-RCVD 状态的 TCP 平均连接数(1分钟内) TCP_alloc - 已分配(已建立、已申请到sk_buff)的TCP套接字数量 TCP_inuse - 正在使用(正在侦听)的TCP套接字数量 TCP_tw - 等待关闭的TCP连接数", "fill": 0, "gridPos": { "h": 8, "w": 13, "x": 11, "y": 20 }, "height": "300", "id": 158, "legend": { "alignAsTable": true, "avg": false, "current": true, "max": true, "min": false, "rightSide": true, "show": true, "total": false, "values": true }, "lines": true, "linewidth": 1, "links": [], "nullPointMode": "null", "percentage": false, "pointradius": 5, "points": false, "renderer": "flot", "seriesOverrides": [], "spaceLength": 10, "stack": false, "steppedLine": false, "targets": [ { "expr": "node_netstat_Tcp_CurrEstab{instance=~'$node'}", "format": "time_series", "hide": false, "interval": "10s", "intervalFactor": 1, "legendFormat": "ESTABLISHED", "refId": "A", "step": 20 }, { "expr": "node_sockstat_TCP_tw{instance=~'$node'}", "format": "time_series", "intervalFactor": 1, "legendFormat": "TCP_tw", "refId": "D" }, { "expr": "irate(node_netstat_Tcp_ActiveOpens{instance=~'$node'}[1m])", "format": "time_series", "hide": false, "intervalFactor": 1, "legendFormat": "ActiveOpens", "refId": "B" }, { "expr": "irate(node_netstat_Tcp_PassiveOpens{instance=~'$node'}[1m])", "format": "time_series", "intervalFactor": 1, "legendFormat": "PassiveOpens", "refId": "C" }, { "expr": "node_sockstat_TCP_alloc{instance=~'$node'}", "format": "time_series", "intervalFactor": 1, "legendFormat": "TCP_alloc", "refId": "E" }, { "expr": "node_sockstat_TCP_inuse{instance=~'$node'}", "format": "time_series", "intervalFactor": 1, "legendFormat": "TCP_inuse", "refId": "F" } ], "thresholds": [], "timeFrom": null, "timeRegions": [], "timeShift": null, "title": "TCP 连接情况", "tooltip": { "shared": true, "sort": 0, "value_type": "individual" }, "transparent": false, "type": "graph", "xaxis": { "buckets": null, "mode": "time", "name": null, "show": true, "values": [] }, "yaxes": [ { "format": "short", "label": null, "logBase": 1, "max": null, "min": null, "show": true }, { "format": "short", "label": null, "logBase": 1, "max": null, "min": null, "show": true } ], "yaxis": { "align": false, "alignLevel": null } }, { "aliasColors": {}, "bars": false, "dashLength": 10, "dashes": false, "datasource": "${DS_PROMETHEUS}", "fill": 1, "gridPos": { "h": 8, "w": 24, "x": 0, "y": 28 }, "height": "300", "id": 157, "legend": { "alignAsTable": false, "avg": false, "current": true, "hideEmpty": true, "hideZero": true, "max": false, "min": false, "show": true, "total": false, "values": true }, "lines": true, "linewidth": 2, "links": [], "nullPointMode": "null", "percentage": false, "pointradius": 5, "points": false, "renderer": "flot", "seriesOverrides": [ { "alias": "/.*_out上传$/", "transform": "negative-Y" } ], "spaceLength": 10, "stack": false, "steppedLine": false, "targets": [ { "expr": "irate(node_network_receive_bytes_total{instance=~'$node',device!~'tap.*'}[5m])*8", "format": "time_series", "intervalFactor": 2, "legendFormat": "{{device}}_in下载", "refId": "A", "step": 4 }, { "expr": "irate(node_network_transmit_bytes_total{instance=~'$node',device!~'tap.*'}[5m])*8", "format": "time_series", "intervalFactor": 2, "legendFormat": "{{device}}_out上传", "refId": "B", "step": 4 } ], "thresholds": [], "timeFrom": null, "timeRegions": [], "timeShift": null, "title": "网络流量", "tooltip": { "shared": true, "sort": 0, "value_type": "individual" }, "type": "graph", "xaxis": { "buckets": null, "mode": "time", "name": null, "show": true, "values": [] }, "yaxes": [ { "format": "bps", "label": "上传(-)/下载(+)", "logBase": 1, "max": null, "min": null, "show": true }, { "format": "short", "label": null, "logBase": 1, "max": null, "min": null, "show": false } ], "yaxis": { "align": false, "alignLevel": null } } ], "refresh": false, "schemaVersion": 16, "style": "dark", "tags": [ "StarsL", "Prometheus" ], "templating": { "list": [ { "auto": true, "auto_count": 30, "auto_min": "10s", "current": { "text": "1m", "value": "1m" }, "hide": 0, "label": "interval", "name": "interval", "options": [ { "selected": false, "text": "auto", "value": "$__auto_interval_interval" }, { "selected": true, "text": "1m", "value": "1m" }, { "selected": false, "text": "10m", "value": "10m" }, { "selected": false, "text": "30m", "value": "30m" }, { "selected": false, "text": "1h", "value": "1h" }, { "selected": false, "text": "6h", "value": "6h" }, { "selected": false, "text": "12h", "value": "12h" }, { "selected": false, "text": "1d", "value": "1d" }, { "selected": false, "text": "7d", "value": "7d" }, { "selected": false, "text": "14d", "value": "14d" }, { "selected": false, "text": "30d", "value": "30d" } ], "query": "1m,10m,30m,1h,6h,12h,1d,7d,14d,30d", "refresh": 2, "skipUrlSync": false, "type": "interval" }, { "allFormat": "glob", "allValue": null, "current": {}, "datasource": "${DS_PROMETHEUS}", "definition": "", "hide": 0, "includeAll": false, "label": "环境", "multi": false, "multiFormat": "regex values", "name": "env", "options": [], "query": "label_values(node_exporter_build_info,env)", "refresh": 1, "regex": "", "skipUrlSync": false, "sort": 1, "tagValuesQuery": "", "tags": [], "tagsQuery": "", "type": "query", "useTags": false }, { "allFormat": "glob", "allValue": null, "current": {}, "datasource": "${DS_PROMETHEUS}", "definition": "", "hide": 0, "includeAll": false, "label": "主机名", "multi": false, "multiFormat": "regex values", "name": "name", "options": [], "query": "label_values(node_exporter_build_info{env='$env'},name)", "refresh": 1, "regex": "", "skipUrlSync": false, "sort": 1, "tagValuesQuery": "", "tags": [], "tagsQuery": "", "type": "query", "useTags": false }, { "allFormat": "glob", "allValue": null, "current": {}, "datasource": "${DS_PROMETHEUS}", "definition": "", "hide": 0, "includeAll": false, "label": "节点", "multi": false, "multiFormat": "regex values", "name": "node", "options": [], "query": "label_values(node_exporter_build_info{name='$name'},instance)", "refresh": 1, "regex": "", "skipUrlSync": false, "sort": 1, "tagValuesQuery": "", "tags": [], "tagsQuery": "", "type": "query", "useTags": false }, { "allValue": null, "current": {}, "datasource": "${DS_PROMETHEUS}", "definition": "", "hide": 2, "includeAll": false, "label": "", "multi": false, "name": "maxmount", "options": [], "query": "query_result(topk(1,sort_desc (max(node_filesystem_size_bytes{instance=~'$node',fstype=~"ext4|xfs"}) by (mountpoint))))", "refresh": 1, "regex": "/.*\"(.*)\".*/", "skipUrlSync": false, "sort": 0, "tagValuesQuery": "", "tags": [], "tagsQuery": "", "type": "query", "useTags": false } ] }, "time": { "from": "now-5m", "to": "now" }, "timepicker": { "now": true, "refresh_intervals": [ "5s", "10s", "30s", "1m", "5m", "15m", "30m", "1h", "2h", "1d" ], "time_options": [ "5m", "15m", "1h", "6h", "12h", "24h", "2d", "7d", "30d" ] }, "timezone": "browser", "title": "1 Node Exporter 0.16 0.17 for Prometheus 监控展示看板", "uid": "9CWBz0bik", "version": 11 }
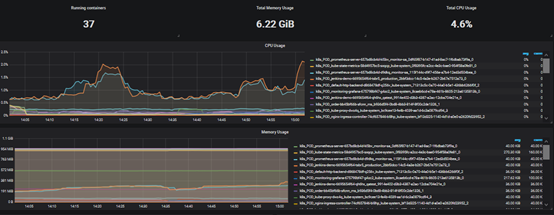
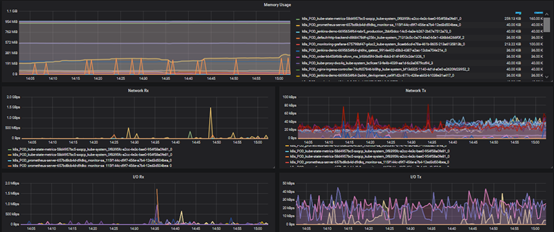
导入docker_rev1.json监控模板,步骤和上面导入node_exporter.json步骤一样,导入之后显示如下:
扩展:如果Grafana导入Prometheusz之后,发现仪表盘没有数据,如何排查?
1、打开grafana界面,找到仪表盘对应无数据的图标

Edit之后出现如下:
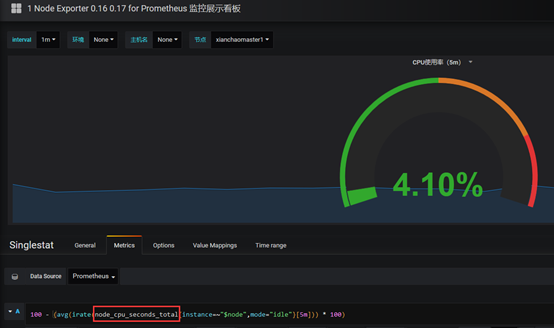
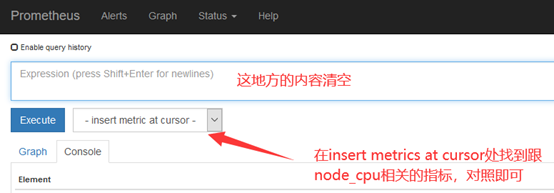
node_cpu_seconds_total 就是grafana上采集的cpu的时间,需要到prometheus ui界面看看采集的指标是否是node_cpu_seconds_total
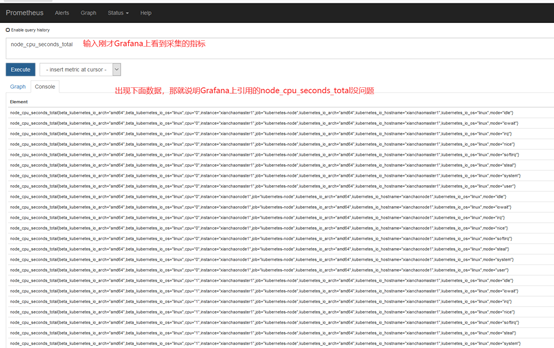
如果在prometheus ui界面输入node_cpu_seconds_total没有数据,那就看看是不是prometheus采集的数据是node_cpu_seconds_totals,怎么看呢?
###grafana展示的数据promQL调用的prometheus,可自己写。显示的名称可参照prometheus多维标签查询结果自定义。