docker日志elk
elk是三个软件的合称:ELasticsearch、Logstash、Kibana
ELasticsearch
一个近乎失明查询的全文搜索引擎,ELasticsearch的设计目标就是要能够处理和搜索巨量的日志数据
Logstash
读取原始日志,并对其进行分析和过滤,然后将其转发给其他组件(比如ELasticsearch)进行索引或存储,Logstash支持丰富的input和output类型,能够处理各种应用的日志
Kibana
一个基于javascript的web图形界面程序,专门用于可视化ELasticsearch的数据。Kibana能够查询ELasticsearch并通过丰富的图标展示结果用户可以创建dashboard来监控系统日志
日志处理流程
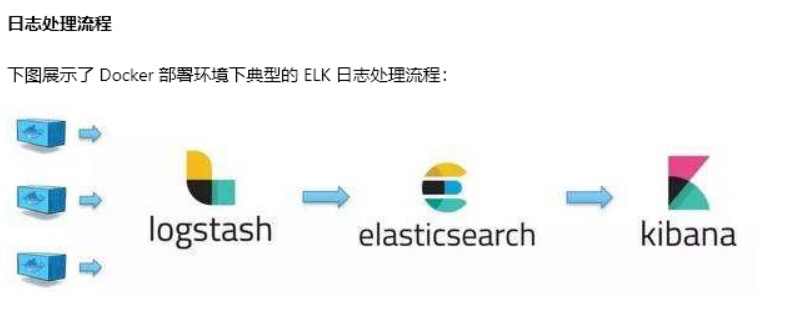
logstash负责从各个docker容器中提取日志,logstash将日志转发到 ELasticsearch进行索引和保存,kibana分析和可视化数据
安装elk套件
vm.max_map_count至少需要262144
[root@localhost ~]# cat /etc/sysctl.conf
# sysctl settings are defined through files in
# /usr/lib/sysctl.d/, /run/sysctl.d/, and /etc/sysctl.d/.
#
# Vendors settings live in /usr/lib/sysctl.d/.
# To override a whole file, create a new file with the same in
# /etc/sysctl.d/ and put new settings there. To override
# only specific settings, add a file with a lexically later
# name in /etc/sysctl.d/ and put new settings there.
#
# For more information, see sysctl.conf(5) and sysctl.d(5).
vm.max_map_count = 262144
执行sysctl -p查看
[root@localhost ~]# sysctl -p
vm.max_map_count = 262144
下载elk镜像
[root@localhost ~]# docker pull sebp/elk
启动堆栈,运行具有2gb堆大小的elasticsarch和具有1gb堆大小的logstash
[root@localhost ~]# docker run -p 5601:5601 -p 9200:9200 -p 5044:5044 -dit -e ES_HEAP_SIZE="2g" -e LS_HEAP_SIZE="1g" --name elk sebp/elk
1f42b594233c71663345143af7c1ca3c5042caf7c646b059e2f8b6ef9f9c3f7e
此命令发布以下端口,这些端口是正确操作elk堆栈所需要的的:
5601(kibana web界面)
9200(elasticsearch json接口)
5044(logstash beats界面,从beats接收日志,如filebeat)
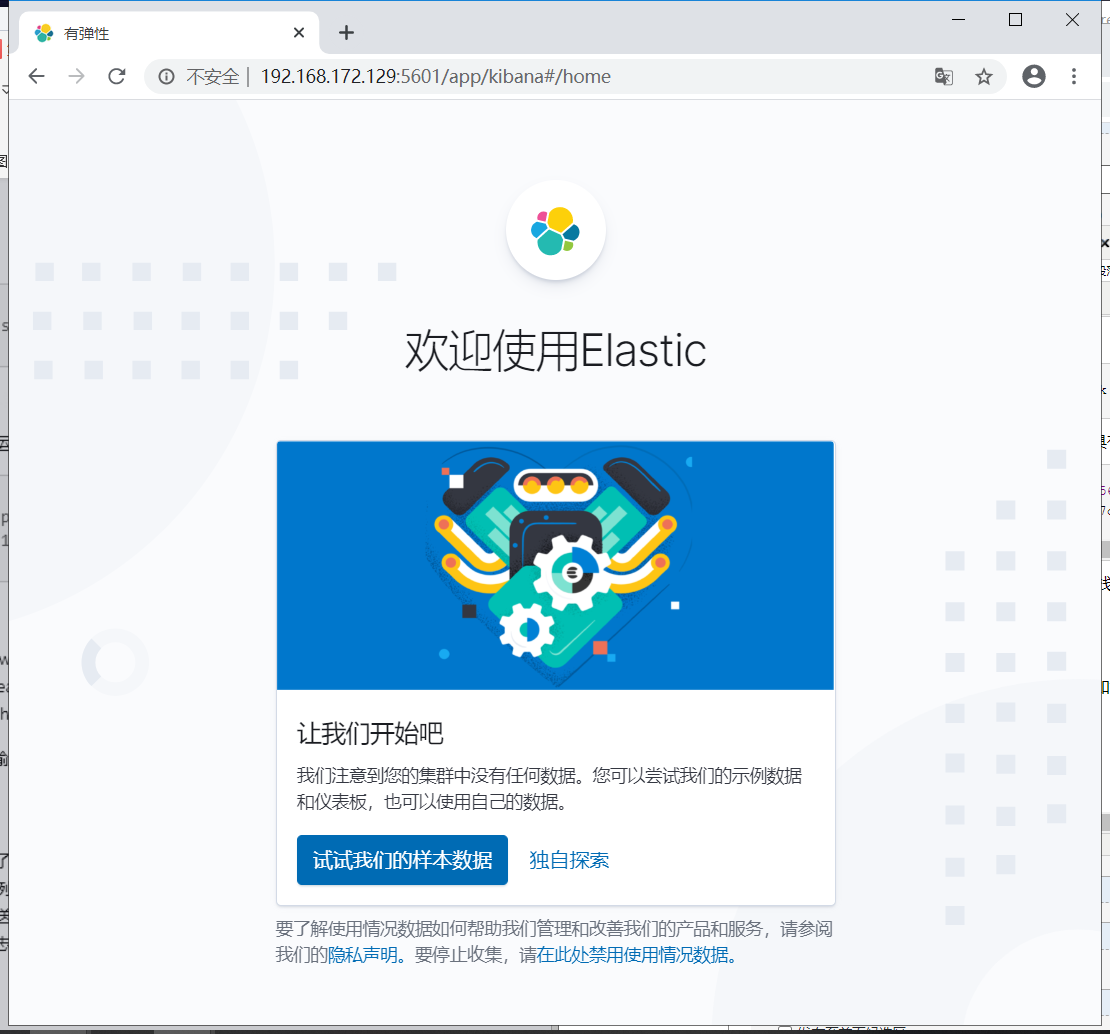
打开浏览器,访问kibana web
安装filebeat
rpm -iv filebeat-7.7.0-x86_64.rpm
配置filebeat
文件里面要写出监控那些日志、将日志发送到哪里
#=========================== Filebeat inputs =============================

filebeat.inputs:

# Each - is an input. Most options can be set at the input level, so
# you can use different inputs for various configurations.
# Below are the input specific configurations.

- type: log

  # Change to true to enable this input configuration.
  enabled: true

  # Paths that should be crawled and fetched. Glob based paths.
  paths:
    #- /var/log/*.log
    - /var/lib/docker/containers/*/*.log
    - /var/log/messages
在paths中我们配置了两条路径
1.、- /var/lib/docker/containers/*/*.log 是所有容器的日志文件
2、 /var/log/massages 查看httpd容器日志所在位置
接下来告诉filebeat 将这些日志发送给elk 。filebeat可以将日志发送给elasticsearch 进行索引和保存
#================================ Outputs =====================================

# Configure what output to use when sending the data collected by the beat.

#-------------------------- Elasticsearch output ------------------------------
output.elasticsearch:
  # Array of hosts to connect to.
  hosts: ["192.168.172.129:9200"]
#============================== Kibana =====================================

# Starting with Beats version 6.0.0, the dashboards are loaded via the Kibana API.
# This requires a Kibana endpoint configuration.
setup.kibana:

  # Kibana Host
  # Scheme and port can be left out and will be set to the default (http and 5601)
  # In case you specify and additional path, the scheme is required: http://localhost:5601/path
  # IPv6 addresses should always be defined as: https://[2001:db8::1]:5601
  host: "192.168.172.129:5601"
启动filebeat
启动elasticsearch模块
filebeat modules enable elasticsearch
初始化filebeat
filebeat setup
systemctl start filebeat
systemctl enable filebeat
现在可以查看收集到的日志了

万能数据收集齐fluentd
安装fluentd
运行一个fluentd容器
[root@localhost ~]# docker run -d -P -v /data:/fluentd/log fluent/fluentd
重新编辑配置文件/etc/filebeat/filebeat.yml 将/data添加到监控路径中,删除其他的输入日志即可
#=========================== Filebeat inputs =============================

filebeat.inputs:

# Each - is an input. Most options can be set at the input level, so
# you can use different inputs for various configurations.
# Below are the input specific configurations.

- type: log

  # Change to true to enable this input configuration.
  enabled: true

  # Paths that should be crawled and fetched. Glob based paths.
  paths:
    #- /var/log/*.log
    #- /var/lib/docker/containers/*/*.log
    #- /var/log/messages
    - /data/*.log
重启filebeat
systemctl restart filebeat
监控容器日志,启动测试容器
docker run -dit --log-driver=fluentd --log-opt fluentd-address=localhost:32768 --log-opt tag="container-A" busybox sh -c 'while true; do echo "this is a log from A"; sleep 10; done;'
docker run -dit --log-driver=fluentd --log-opt fluentd-address=localhost:32768 --log-opt tag="container-B" busybox sh -c 'while true; do echo "this is a log from B"; sleep 10; done;'
--log-driver=flunentd 告诉docker使用fluentd的logging driver
--log-opt fluentd-address=localhost:32768 将容器日志发送到fluentd的数据端口。
--log-opt tag="container-B" 在日志中添加一个可选的tag,用于用于区分不同容器
