clc;close all;clear;
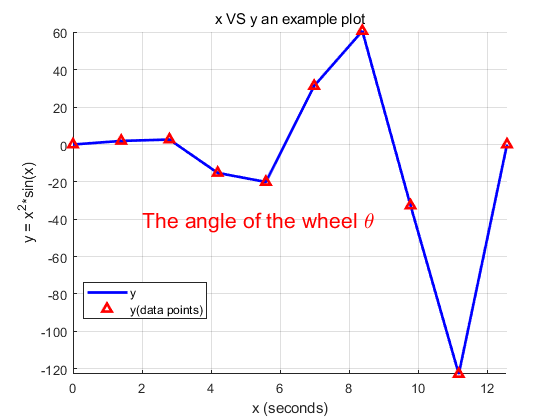
x =linspace(0,4*pi,10);
y = x.^2.*sin(x);
figure
hold on
plot(x,y,'b-','linewidth',2)
plot(x,y,'r^','linewidth',2)
xlabel('x (seconds)')
ylabel('y = x^2*sin(x)')
grid on
title('x VS y an example plot')
legend('y','y(data points)','location','best')
axis([min(x) max(x) min(y) max(y)])
text(2,-40,'The angle of the wheel heta','color','r','FontSize',16,'FontName','Time News Roman')
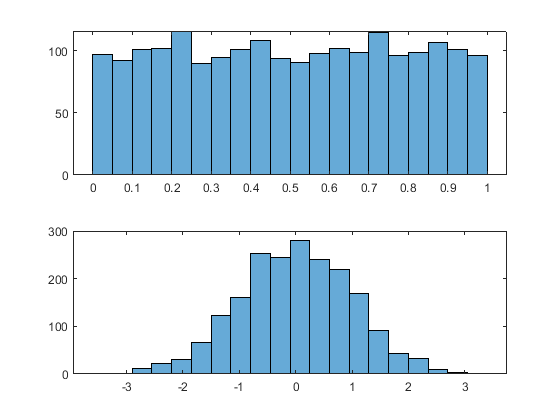
% histogram 直方图
N = 2000;
numBins = 20;
sampleuniform = rand(1,N);
sampleNorm = randn(1,N);
figure
subplot(2,1,1)
histogram(sampleuniform,numBins);%numBins默认是10个
subplot(2,1,2)
histogram(sampleNorm,numBins);
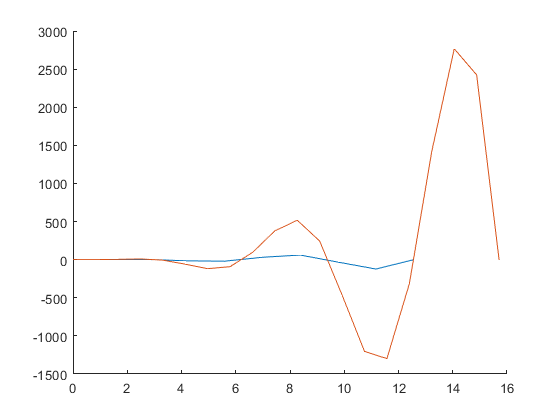
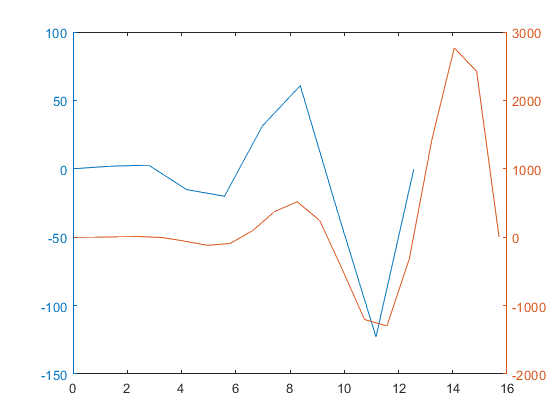
%% plotyy 方便对变化范围差异较大的两幅图进行比较
x2 = linspace(0,5*pi,20);
y2 = x2.^3.*sin(x2);
figure
hold on
plot(x,y)
plot(x2,y2)
figure
plotyy(x,y,x2,y2)
%% semilogx
figure
semilogx(x2,y2)
grid on
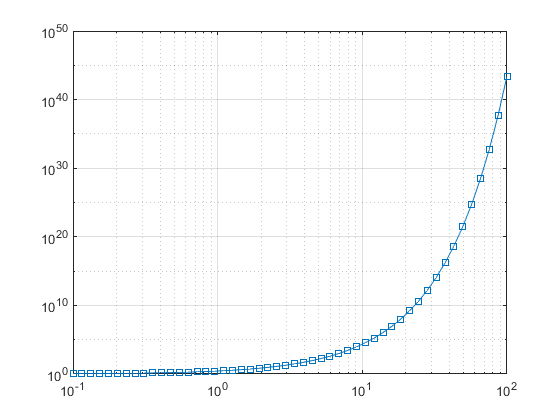
%%loglog()
figure
x3 = logspace(-1,2);
%logspace(a,b)创建10^a到10^b之间分为50份默认的,logspace(a,b,n)创建10^a到10^b之间分为n份
loglog(x3,exp(x3),'-s')
grid on
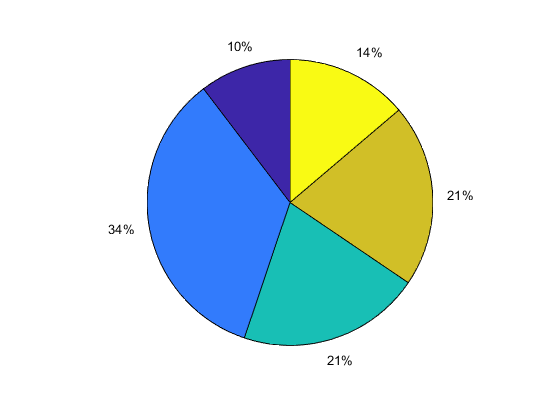
%% pie 饼图
figure
sales = [15 50 30 30 20];
pie(sales)
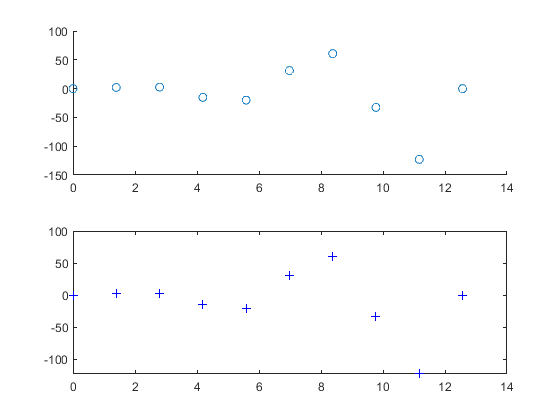
%% scatter
figure
subplot(2,1,1)
scatter(x,y)
subplot(2,1,2)
plot(x,y,'b+')

fplot3 的参考页
https://ww2.mathworks.cn/help/matlab/ref/fplot3.html
fplot 的参考页
https://ww2.mathworks.cn/help/matlab/ref/fplot.html
clc;clear;
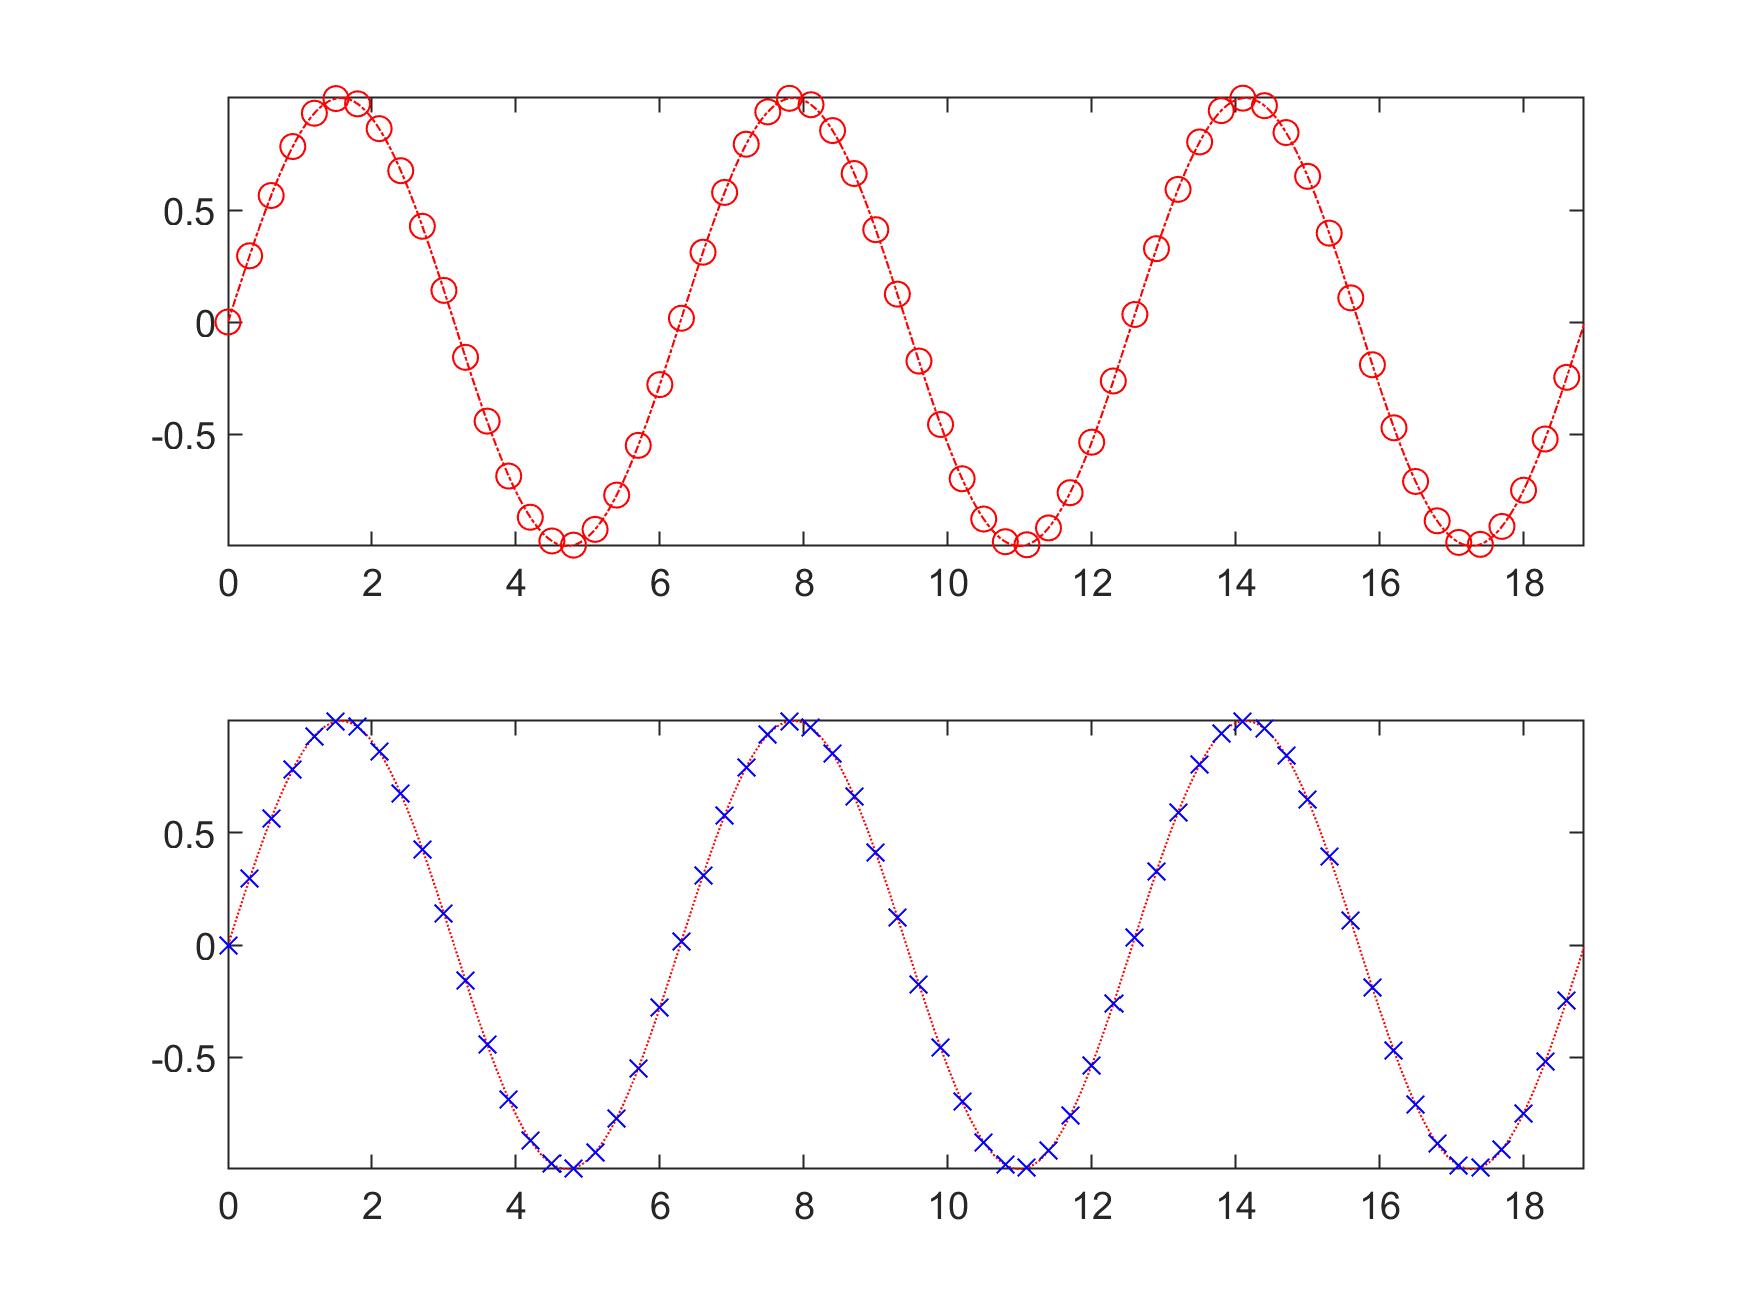
x=0:0.01:6*pi;
y =sin(x);
figure(1);
subplot(2,1,1);
maker_idx = 1:30:length(x);
plot(x,y,'ro-.','LineWidth',0.5,'MarkerIndices',maker_idx);
axis([min(x) max(x) min(y) max(y)])%坐标轴刚好取到函数最大值处
%事后补上绘图特性也可以
subplot(2,1,2);
maker_idx = 1:30:length(x);
g = plot(x,y,'MarkerIndices',maker_idx);
g.Color = 'r';
g.LineStyle = ':';
g.Marker = 'x';
g.MarkerEdgeColor = 'b';
axis([min(x) max(x) min(y) max(y)]) %坐标轴刚好取到函数最大值处
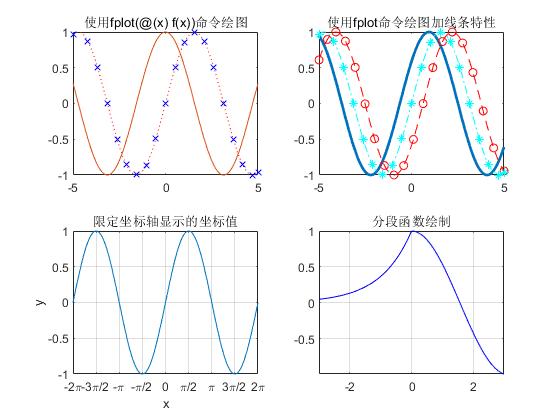
figure(2)
subplot(2,2,1)
fp = fplot(@(x) sin(x),[-5,5]); %这个取matlab自己取默认的x范围[-5,5]
fp.LineStyle = ':';
fp.Color = 'r';
fp.Marker = 'x';
fp.MarkerEdgeColor = 'b';
hold on
fplot(@(x) cos(x))
hold off
title('使用fplot(@(x) f(x))命令绘图')
subplot(2,2,2)
fplot(@(x) sin(x+pi/5),'Linewidth',2);
hold on
fplot(@(x) sin(x-pi/5),'--or');
fplot(@(x) sin(x),'-.*c')
hold off
title('使用fplot命令绘图加线条特性')
subplot(2,2,3)
%限定坐标轴显示的坐标值
fplot(@sin,[-2*pi 2*pi])
grid on
title('sin(x) from -2pi to 2pi')
xlabel('x');
ylabel('y');
ax = gca; %Use gca to access the current axes object
ax.XTick = -2*pi:pi/2:2*pi;
ax.XTickLabel = {'-2pi','-3pi/2','-pi','-pi/2','0','pi/2','pi','3pi/2','2pi'};
title('限定坐标轴显示的坐标值')
subplot(2,2,4)
%画出分段函数
% fplot(f,lims,参数) f代表一个函数,通常采用函数句柄的形式。lims为x轴的取值范围,用二元向量[xmin,xmax]描述
fplot(@(x) exp(x),[-3 0],'b')
hold on
fplot(@(x) cos(x),[0 3],'b')
hold off
grid on
title('分段函数绘制')
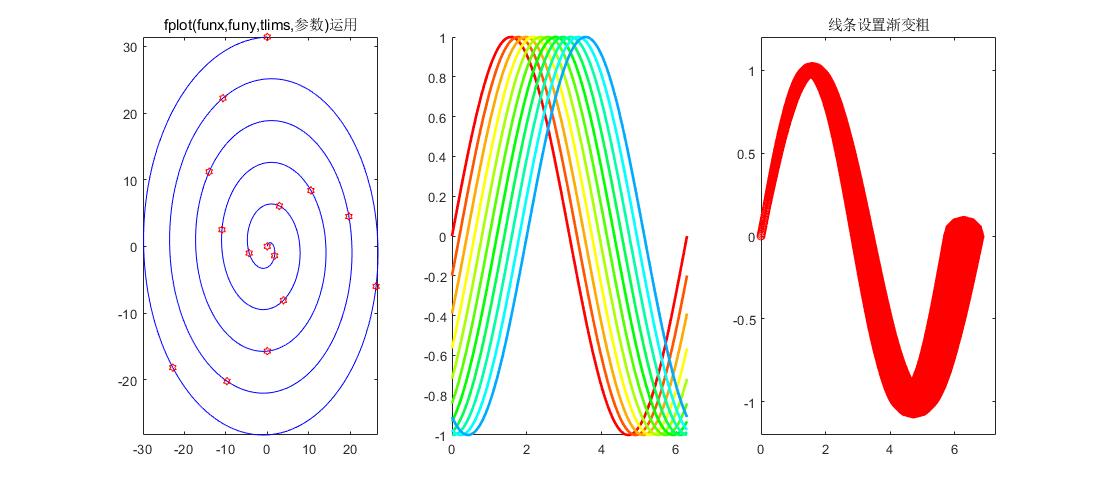
figure(3)
subplot(1,3,1)
% fplot(funx,funy,tlims,参数)
fplot(@(t)t.*sin(t),@(t)t.*cos(t),[0,10*pi],'-bh','MarkerEdgeColor','r')
title('fplot(funx,funy,tlims,参数)运用')
subplot(1,3,2)
dc=hsv(18); % 18 colours are generated
x = 0:pi/100:2*pi;
hold on % you much write this before the plot
i=1;
for d=0:0.2:2, % 11 lines in plot are taken
plot(x,sin(x-d),'color',dc(i,:),'linewidth',2)
i=i+1;
end
subplot(1,3,3)
% 线条设置渐变粗
t=0:0.01:2*pi;
y =sin(t);
plot(t,y,'LineWidth',0.01);
xlim([min(t) max(t+1)]);
ylim([-1.2 1.2]);
hold on
for k=1:1:length(t)
Ld = 0.04*k;
P = plot(t(k),y(k),'ro');
P.LineWidth = Ld;
hold on;
end
title('线条设置渐变粗')