参考: https://zhidao.baidu.com/question/519416083.html
一.坐标轴上标注有导数的情况
xlabel('$dot{x_j}(t)$','Interpreter','latex') 表示绘图标注参数字母有导数的情况
其中 heta lambda 等来表示原字母
示例:
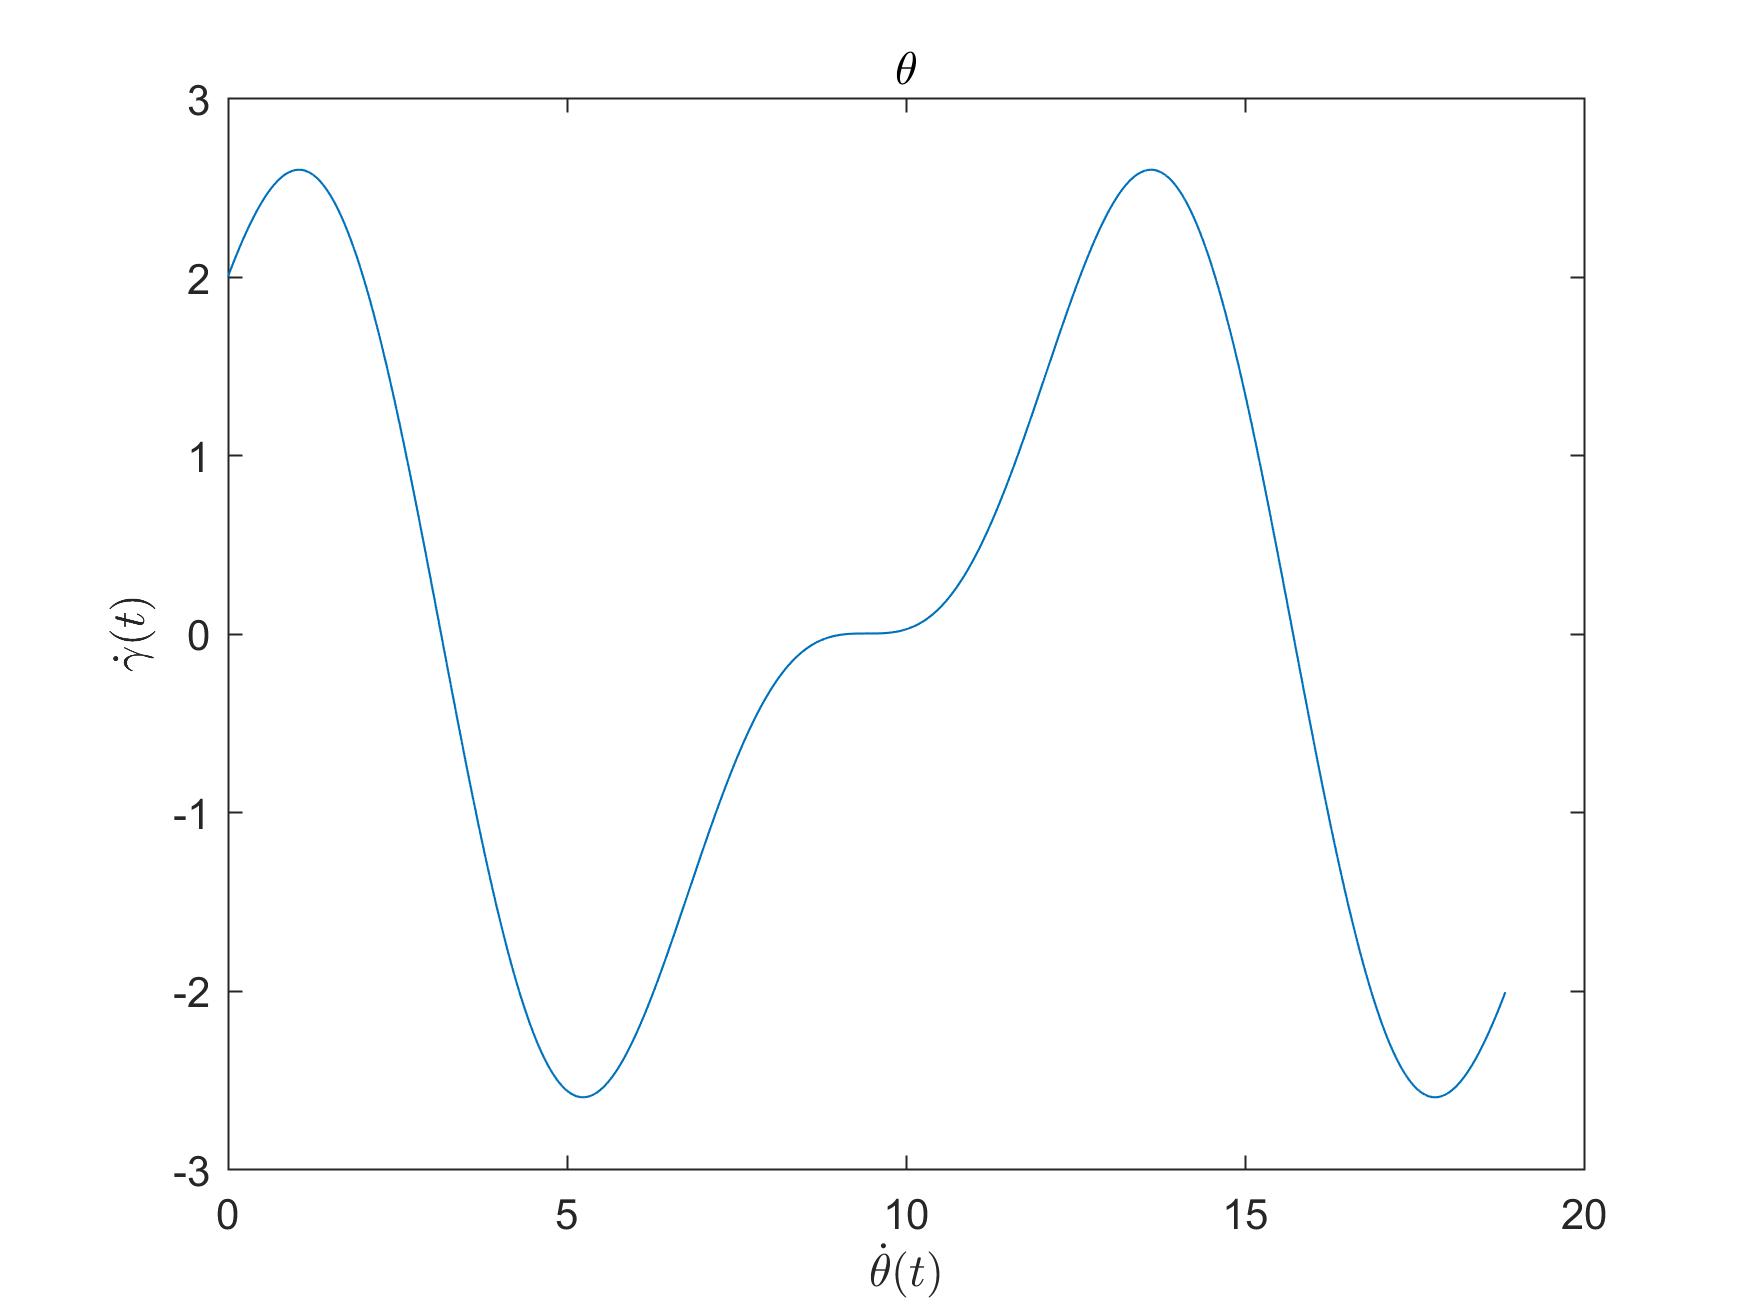
 figure(1)
 x = 0:0.01:6*pi;
 y = sin(x)+2*cos(0.5*x);
 plot(x,y)
 xlabel('$dot{	heta}(t)$','Interpreter','latex');
 ylabel('$dot{gamma}(t)$','Interpreter','latex');
 title('	heta')
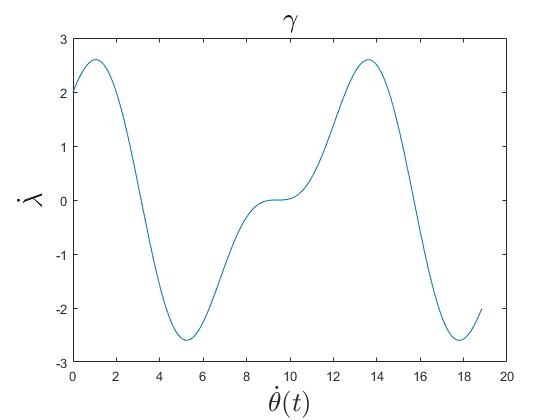
clc;clear;close all;
figure(1)
x = 0:0.01:6*pi;
y = sin(x)+2*cos(0.5*x);
plot(x,y)
%xlabel('$dot{	heta}(t)$','Interpreter','latex')
xlabel('$$dot{	heta}(t)$$','Interpreter','latex','FontName','Times New Roman','FontSize',20);
% ylabel('$dot{gamma}(t)$','Interpreter','latex');
ylabel('$$dot{lambda}$$','interpreter','latex','FontName','Times New Roman','FontSize',20);
title('gamma','FontName','Times New Roman','FontSize',20)
好像用one dollar 也可,two dollars 也可,
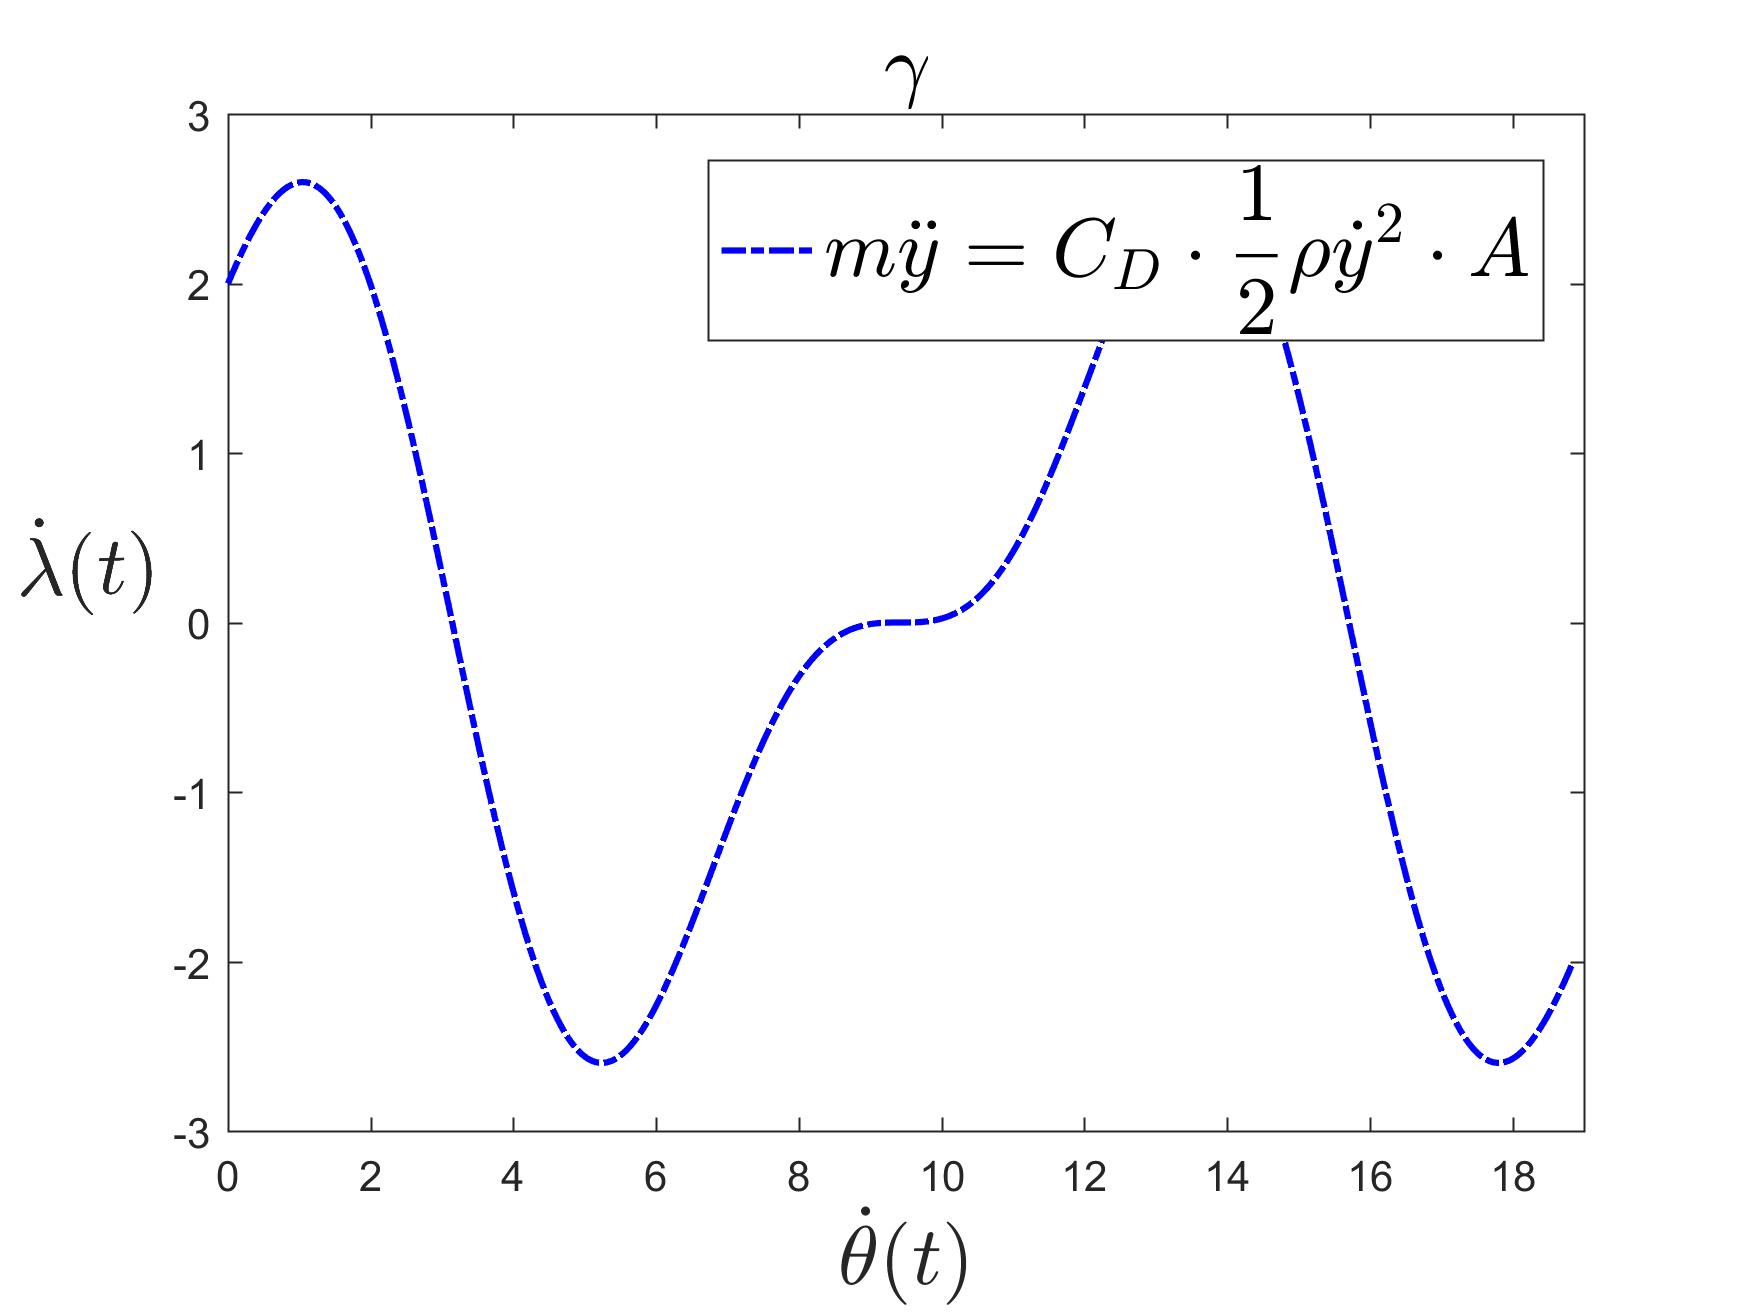
二. 图例中有导数的情况
参考:http://blog.sina.com.cn/s/blog_97db34e80101cneb.html
clc;clear;close all;
figure(1)
x = 0:0.01:6*pi;
y = sin(x)+2*cos(0.5*x);
plot(x,y,'b-.','linewidth',1.5)
%xlabel('$dot{	heta}(t)$','Interpreter','latex')
xlabel('$$dot{	heta}(t)$$','Interpreter','latex','FontName','Times New Roman','FontSize',20);
% ylabel('$dot{gamma}(t)$','Interpreter','latex');
ylabel('$$dot{lambda}$$','interpreter','latex','FontName','Times New Roman','FontSize',20);
title('gamma','FontName','Times New Roman','FontSize',20)
latexStr=['$$m ddot y = C_D cdot {1 over 2}
ho {dot y}^2 cdot A$$'] ;
lgh=legend(latexStr,'FontSize',20);
set(lgh,'interpreter','latex');
axis([0 19 -3 3])
图例中有参数导数形式的表达
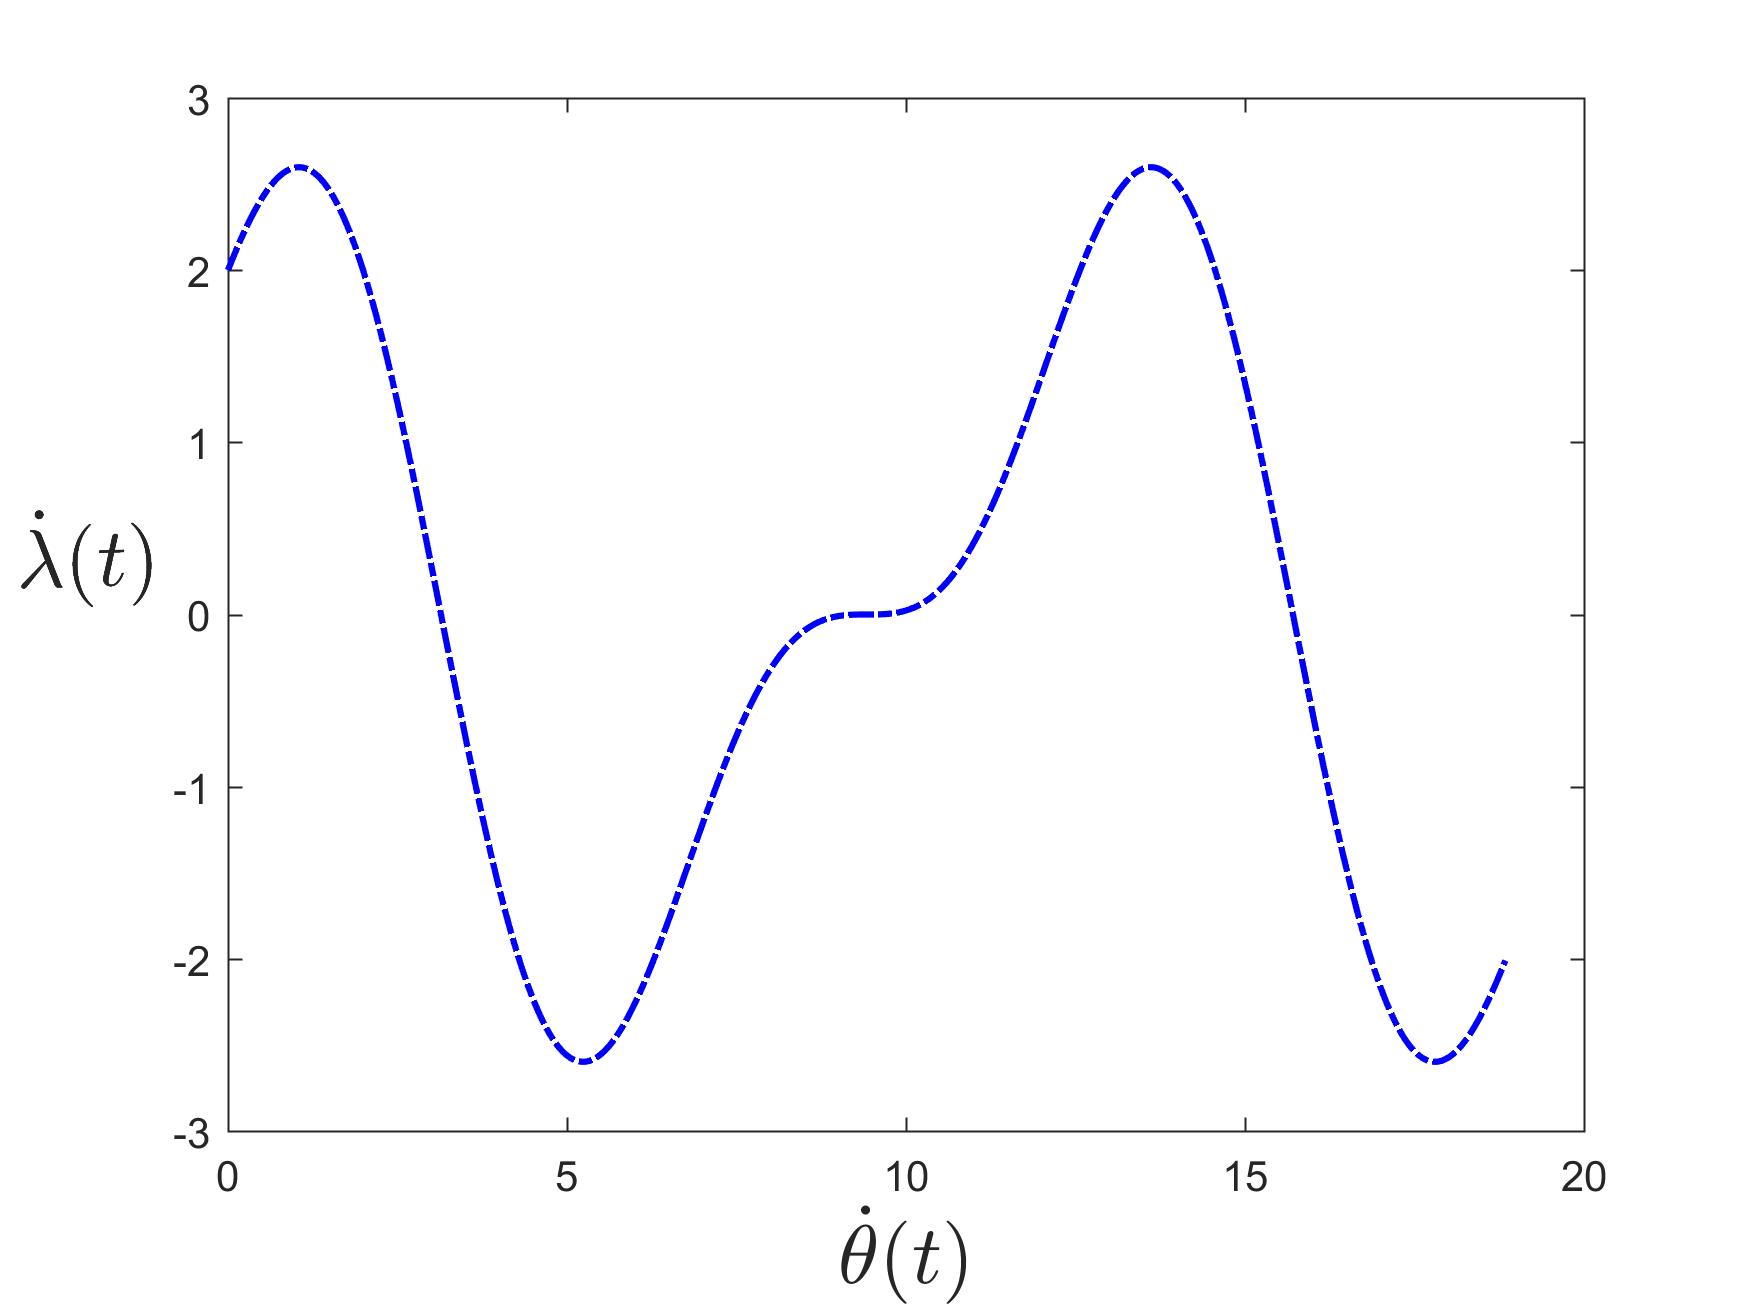
将纵坐标标注转正的情况:
参考: http://blog.sina.com.cn/s/blog_97db34e80101cnlx.html
clc;clear;close all;
figure(1)
x = 0:0.01:6*pi;
y = sin(x)+2*cos(0.5*x);
plot(x,y,'b-.','linewidth',1.5)
%xlabel('$dot{	heta}(t)$','Interpreter','latex')
xlabel('$$dot{	heta}(t)$$','Interpreter','latex','FontName','Times New Roman','FontSize',20);
% ylabel('$dot{gamma}(t)$','Interpreter','latex');
ylabel('$$dot{lambda}$$','interpreter','latex','FontName','Times New Roman','FontSize',20);
ylabel('$$dot{lambda}(t)$$','interpreter','latex','FontName','Times New Roman','FontSize',20,'rotation',pi/2,'HorizontalAlignment','right');
其中的rotation就是旋转纵坐标标注,pi/2是旋转角度,HorizontalAlignment表示对齐方式,这里right表示靠左排列。