# _*_ coding: gbk _*_
# @Author: Wonde
# bar 直方图
import matplotlib.pyplot as plt # 绘图
from matplotlib.font_manager import FontProperties # 管理字体
font = FontProperties(fname=r'STLITI.TTF') # 设置字体 设置路径即可
plt.style.use('ggplot') # 样式可选,默认ggplot和classic
# print(plt.style.available) #查看可以使用的背景样式
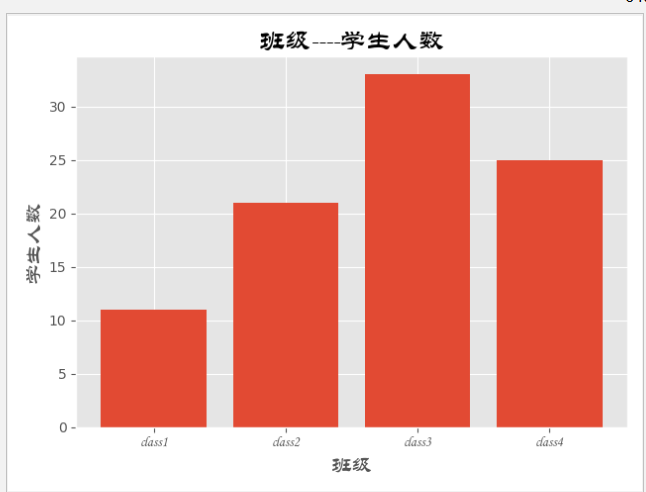
classes = ['class1', 'class2', 'class3', 'class4'] # x轴数据
studentnum = [11, 21, 33, 25] # y轴数据
classes_index = range(len(classes)) # 传一个可迭代对象range是一个可迭代对象,目的是为了让非数字的X轴均匀分布,通过索引实现
#画布设计
fig = plt.figure() #实例化一个对象
ax1 = fig.add_subplot(1, 1, 1) # 将一个画布分为几(1)行(1)列以及选定第(1)张add_subplot(1, 1, 1)
ax1.bar(classes_index, studentnum) # 设置一些参数
# def bar(self, x, height, width=0.8, bottom=None, *, align="center",**kwargs):
# 设置刻度值的显示位置
ax1.xaxis.set_ticks_position('bottom') # 刻度 x的刻度在底部,y的刻度在左边
ax1.yaxis.set_ticks_position('left')
#设置X轴的刻度和数据,X轴因为不是具体数据,故用他所在的数组位置进行等差取值。
plt.xticks(classes_index, classes, rotation=0, fontsize=12, FontProperties=font)
# 设置x和y轴以及标题栏的名字
plt.xlabel('班级', FontProperties=font, Fontsize=15)
plt.ylabel('学生人数', FontProperties=font, Fontsize=15)
plt.title('班级----学生人数', FontProperties=font, Fontsize=19)
plt.show()
****************************************************************************************************************************************************
# _*_ coding: gbk _*_
# @Author: Wonde
# bar 直方图

import matplotlib.pyplot as plt  # 绘图
from matplotlib.font_manager import FontProperties  # 管理字体

font = FontProperties(fname=r'STLITI.TTF')  # 设置字体 设置路径即可
plt.style.use('ggplot')  # 样式可选,默认ggplot和classic
# print(plt.style.available)  #查看可以使用的背景样式
classes = ['class1', 'class2', 'class3', 'class4']  # x轴数据
studentnum = [11, 21, 33, 25]    # y轴数据
classes_index = range(len(classes))  # 传一个可迭代对象range是一个可迭代对象
#画布设计
fig = plt.figure()  #实例化一个对象
ax1 = fig.add_subplot(1, 1, 1)  # 将一个画布分为几(1)行(1)列以及选定第(1)张add_subplot(1, 1, 1)

ax1.barh( classes_index, studentnum)  # 设置一些参数
#     def barh(self, y, width, height=0.8, left=None, *, align="center",**kwargs):
# 设置刻度值的显示位置
ax1.xaxis.set_ticks_position('bottom')  # 刻度 x的刻度在底部,y的刻度在左边
ax1.yaxis.set_ticks_position('left')

# yticks设置y轴的刻度值 和数据,此时Y轴是班级,不是一个具体数值,所以需要用索引来做均分间隔。
plt.yticks(classes_index, classes, rotation=0, fontsize=12, FontProperties=font)


# 设置x和y轴以及标题栏的名字
plt.xlabel('学生人数', FontProperties=font, Fontsize=15)
plt.ylabel('班级', FontProperties=font, Fontsize=15)
plt.title('班级----学生人数', FontProperties=font, Fontsize=19)
plt.show()

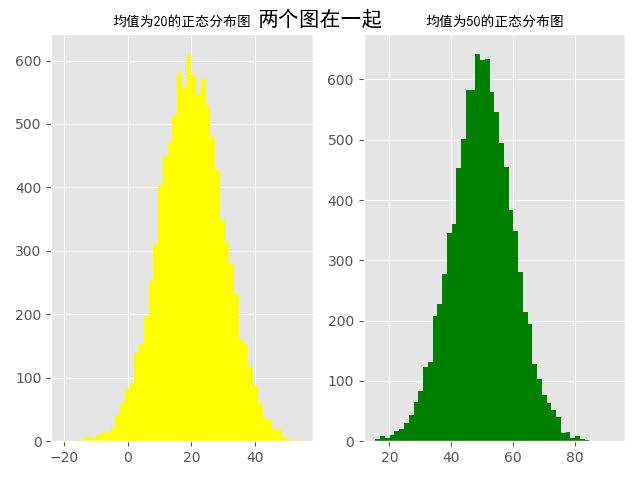
重在理解!!!
高斯分布,又称为正态分布。秘籍的直方图可以绘制出高斯分布图
# _*_ coding: gbk _*_
# @Author: Wonder
import numpy as np
import matplotlib.pyplot as plt
from matplotlib.font_manager import FontProperties

font = FontProperties(fname='simhei.ttf')
plt.style.use('ggplot')
num1, num2, sigama = 20, 50, 10
# 构造符合均值为20的正态分布,以及均值为50的正态分布。
x1 = num1 + sigama * np.random.randn(10000)  # 10000为构造随机数的个数
x2 = num2 + sigama * np.random.randn(10000)

fig = plt.figure()  # 初始化画板
ax1 = fig.add_subplot(1, 2, 1)
ax1.hist(x1, bins=50, color='yellow')  # bins=50表示分成50份,即会有50个直方图组成正态分布大图
ax2 = fig.add_subplot(122)

ax2.hist(x2, bins=50, color='green')

fig.suptitle('两个图在一起', fontproperties=font, fontweight='bold',
             fontsize=15)  # fontweight为字体粗细,bold为粗体,fontproperties字体属性
ax1.set_title('均值为20的正态分布图', fontproperties=font)
ax2.set_title('均值为50的正态分布图', fontproperties=font)
plt.show()