<template>
<div class="echarts">
<IEcharts :option="pie" @ready="onReady" @click="onClick"></IEcharts>
</div>
</template>
<script>
import IEcharts from 'vue-echarts-v3/src/lite.js';
import 'echarts/lib/component/title'; //引入标题组件
import 'echarts/lib/component/legend'; //引入图例组件
import 'echarts/lib/chart/pie';
export default {
components: {IEcharts},
data: () => ({
pie: {
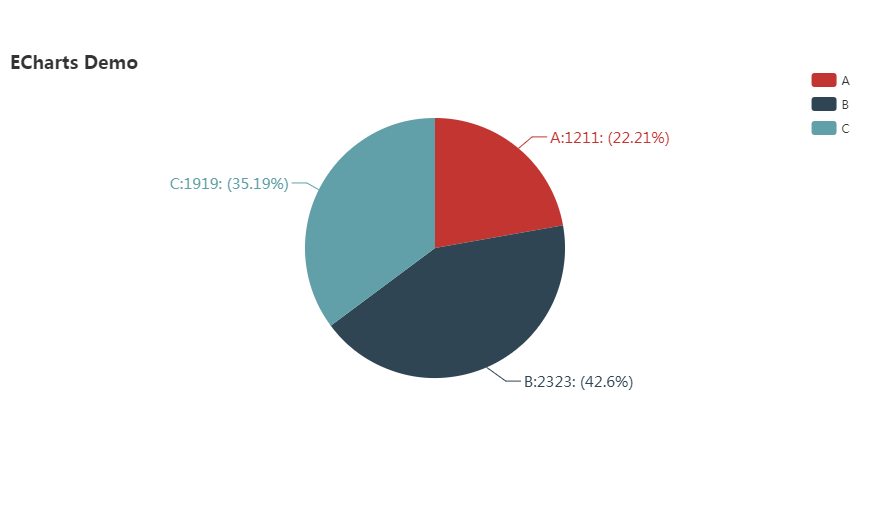
title: {
text: 'ECharts Demo'
},
tooltip: {},
legend:{
type: 'plain',
orient: 'vertical',
right: 10,
top: 20,
},
series: [{
type: 'pie',
radius : '65%',
center : [ '50%', '50%' ],
label : {
normal : {
formatter: '{b}:{c}: ({d}%)',
textStyle : {
fontWeight : 'normal',
fontSize : 15
}
}
},
data: [
{name: 'A', value: 1211},
{name: 'B', value: 2323},
{name: 'C', value: 1919}
]
}]
}
}),
methods: {
onReady(instance) {
console.log(instance);
},
onClick(event, instance, echarts) {
console.log(arguments);
}
}
};
</script>
<style scoped>
.echarts{
400px;
height: 400px;
margin: auto;
text-align: center;
}
</style>