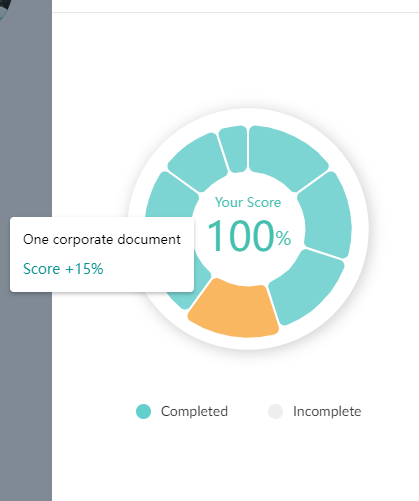
效果展示

实现代码
原理主要还是用两个饼图嵌套,外侧做阴影,内层放数据。配置比较复杂,怕下次遇到就做个记录吧。
      initEcharts() {
        const myChart = echarts.init(this.$refs.chart)
        const userScore = this.userScore.slice(0, this.userScore.length - 1)
        let option = {
          tooltip: {
            trigger: 'item',
            renderMode: 'html',
            formatter: "<div style='color: #000000;font-style: normal;font-weight: 500;font-size: 13PX;line-height: 18PX;'>{b0}</div><div style='color: #0a9391;margin-top:10PX;'>Score +{c0}%</div>",
            borderColor: '#fff',
            padding: 12,
            extraCssText: 'box-shadow: 0PX 2PX 4PX rgba(0, 0, 0, 0.25);',
          },
          legend: {
            show: false,
          },
          title: [{
            text: `{a|Your Score}\n{b|${userScore}}{c|%}`,
            top: 'center',
            left: 'center',
            textStyle: {
              fontFamily: 'PingFang SC',
              fontStyle: 'normal',
              fontWeight: 500,
              rich: {
                a: {
                  color: '#47bfaf',
                  padding: [0, 0, 10, 0],
                  fontSize: 13,
                },
                b: {
                  color: '#47bfaf',
                  fontSize: 40,
                },
                c: {
                  color: '#47bfaf',
                  fontSize: 18,
                },
              },
            },
          }, ],
          series: [{
              name: 'border',
              type: 'pie',
              clockWise: false,
              radius: '75%',
              center: ['50%', '50%'],
              animation: false,
              data: [{
                value: 0,
                color: '#fff',
                label: {
                  show: false,
                },
                labelLine: {
                  show: false,
                },
                emphasis: {
                  disabled: true,
                },
                select: {
                  disabled: true,
                },
                tooltip: {
                  show: false,
                },
                itemStyle: {
                  color: '#fff',
                  shadowColor: 'rgba(0, 0, 0, 0.2)',
                  shadowBlur: 15,
                  shadowOffsetX: 2,
                  shadowOffsetY: 2,
                },
              }, ],
            },
            {
              name: '',
              type: 'pie',
              radius: ['35%', '65%'],
              center: ['50%', '50%'],
              avoidLabelOverlap: false,
              selectedMode: false,
              select: {
                itemStyle: {
                  color: '#f9b762',
                },
              },
              itemStyle: {
                borderRadius: 10,
                borderColor: '#fff',
                borderWidth: 2,
                emphasis: {
                  color: '#f9b762',
                },
                borderRadius: 7,
              },
              label: {
                show: false,
                position: 'center',
              },
              emphasis: {
                label: {
                  show: false,
                },
              },
              labelLine: {
                show: false,
              },
              data: this.echartsData,
            },
          ],
        }
        option && myChart.setOption(option)
      },