Tensorflow = Tensor(张量) + flow(数据流图)
1、张量
张量可不是“麻辣烫”!张量是一个很抽象的概念,直观的来说,张量在tensorflow中就像一个杯子,起到保存数据的作用,我们也可以把张量看成一个不同维度的数组。
0阶的张量是一个标量,就是一个数值;
1阶的张量是一个向量;
2阶的张量是一个矩阵;
3阶的张量是一个三维矩阵。
以此类推...
#定义0阶张量
a = tf.constant(2.,name="a")
#定义1阶张量
b = tf.constant([3],name="b")
#定义2阶张量
c = tf.constant([[4,5]],name="c")
print(a)
print(b)
print(c)
输出结果:
Tensor("a:0", shape=(), dtype=float32)
Tensor("b:0", shape=(1,), dtype=int32)
Tensor("c:0", shape=(1, 2), dtype=int32)
a、b、c三个张量分别是0阶、1阶、2阶,可以看出来Tensor有类型、形状两个属性。
2、数据流图

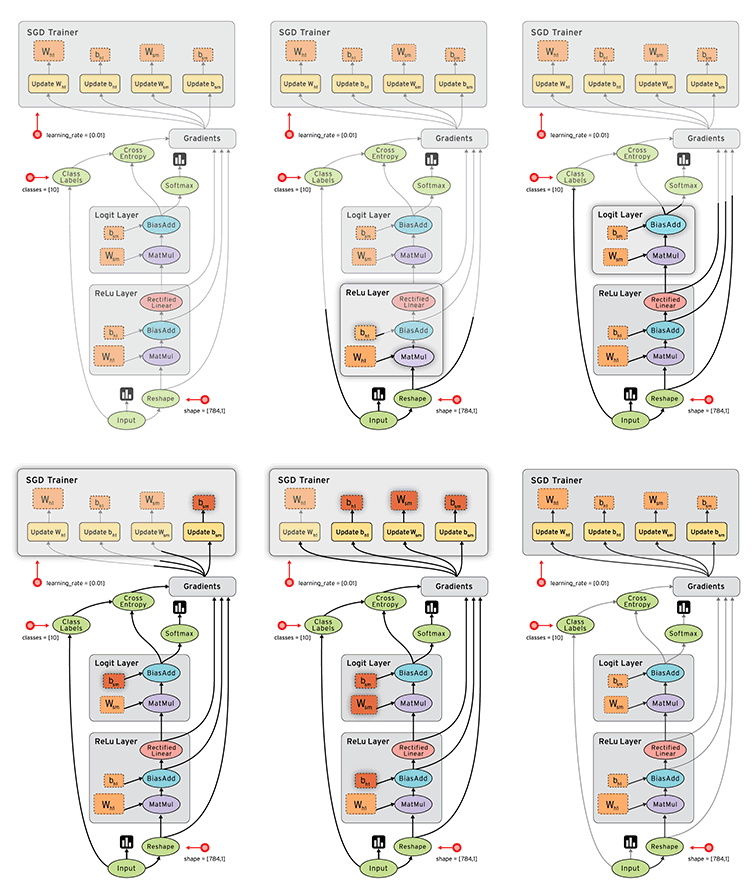
如果大家看过官方的教程,那么对上图肯定很熟悉。所谓Tensorflow,简单的说,就是tensor(张量)数据在图中flow(流动)计算的过程。
import tensorflow as tf
tf.reset_default_graph()

with tf.variable_scope("a"):
    a = tf.constant(1,name="a")

with tf.variable_scope("b"):
    b = tf.constant(2,name="b")

with tf.variable_scope("c"):
    c = tf.constant(3,name="c")

output1 = tf.add(a,b,name="out1")
output2 = tf.add(c,output1,name="out2")
write = tf.summary.FileWriter("E://logs",tf.get_default_graph())
write.close()
我这里使用tensorboard来查看数据流图,将数据流图存储在e://logs目录下,然后终端执行:
tensorboard --logdir=e://logs//
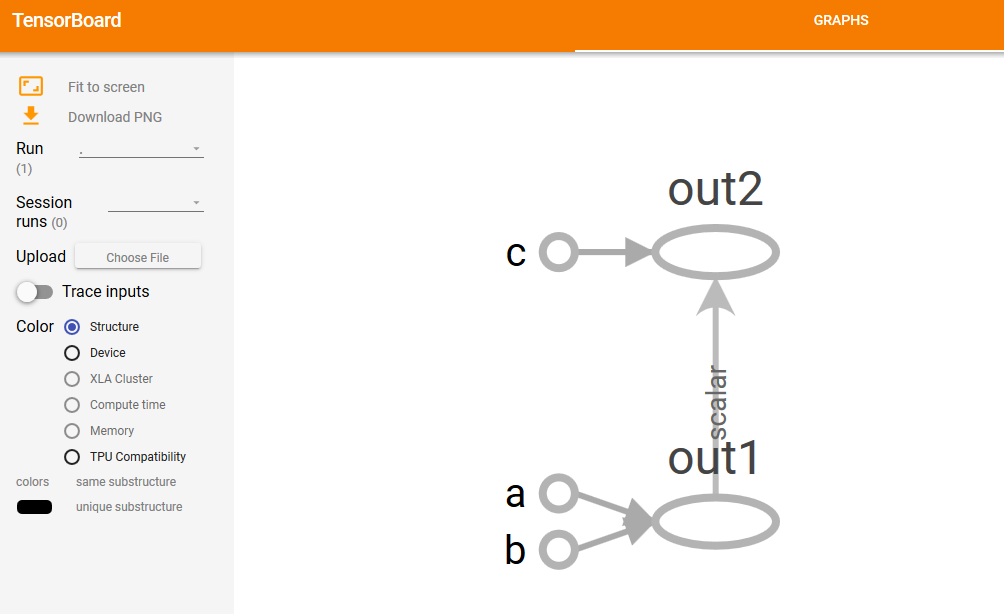
打开tensorboard可以看到如图结果:

这个数据流图就为我们很好的演示了“tensor(张量)数据在图中flow(流动)计算的过程”。我们定义三个张量a,b,c,其中out1=a+b,out2=out1+c,得到最终结果。