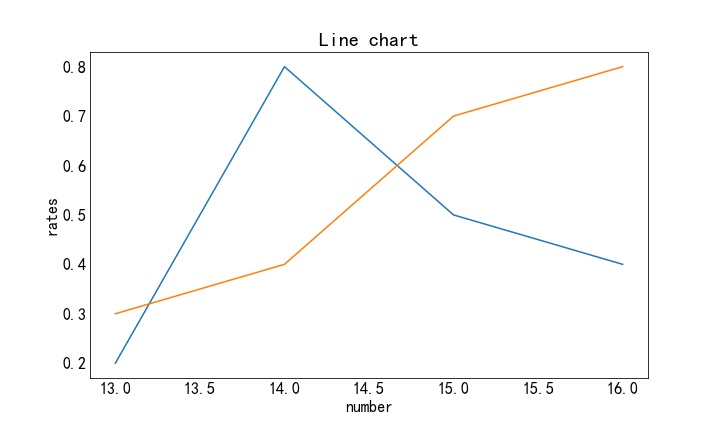
# 使用matplotlib绘制折线图
import matplotlib.pyplot as plt
import numpy as np


# 在一个图形中创建两条线
fig = plt.figure(figsize=(10,6))
ax1 =fig.add_subplot(1,1,1)

ax1.set_xlabel('number')
ax1.set_ylabel('rates')
ax1.set_title("Line chart")

ax1.plot([13, 14, 15, 16], [0.2, 0.8, 0.5, 0.4])
ax1.plot([13, 14, 15, 16], [0.3, 0.4, 0.7, 0.8])

plt.savefig('line_chart.jpg')
plt.show()
