准备:使用vue-cli脚手架
如果你已经有自己的项目,可以跳过这一步。
npm下载vue-cli脚手架
(写这篇文章时用的还是vue-cli2)
npm install -g @vue/cli初始化一个项目
vue init webpack hello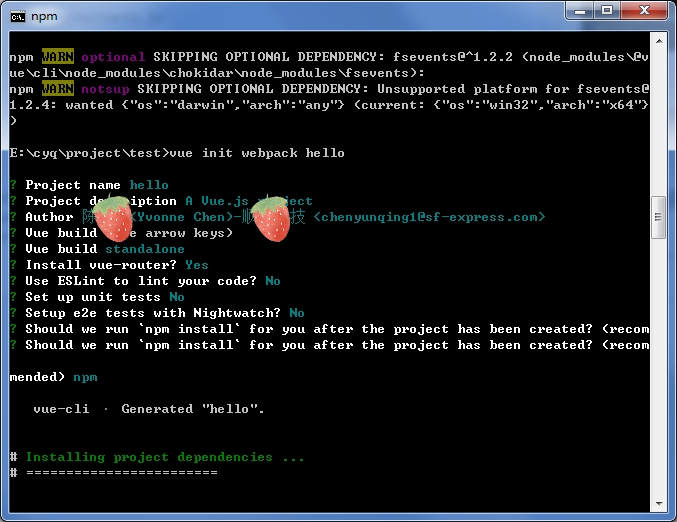
然后等待它安装完所有的依赖包就可以了。
下面我们开始引入echarts。
方式一、直接引入echarts
先npm安装echarts
npm install echarts --save开发:
main.js
import myCharts from './comm/js/myCharts.js'
Vue.use(myCharts)
myCharts.js
/**
 * 各种画echarts图表的方法都封装在这里
 * 注意:这里echarts没有采用按需引入的方式,只是为了方便学习
 */

import echarts from 'echarts'
const install = function(Vue) {
    Object.defineProperties(Vue.prototype, {
        $chart: {
            get() {
                return {
                    //画一条简单的线
                    line1: function (id) {
                        this.chart = echarts.init(document.getElementById(id));
                        this.chart.clear();

                        const optionData = {
                            xAxis: {
                                type: 'category',
                                data: ['Mon', 'Tue', 'Wed', 'Thu', 'Fri', 'Sat', 'Sun']
                            },
                            yAxis: {
                                type: 'value'
                            },
                            series: [{
                                data: [820, 932, 901, 934, 1290, 1330, 1320],
                                type: 'line',
                                smooth: true
                            }]
                        };

                        this.chart.setOption(optionData);
                    },
                }
            }
        }
    })
}

export default {
    install
}
HelloWorld.vue
<template>
  <div class="hello">
    <div id="chart1"></div>
  </div>
</template>

<script>
export default {
  name: 'HelloWorld',
  data () {
    return {
    }
  },
  mounted() {
    this.$chart.line1('chart1');
  }
}
</script>

<style scoped>
  #chart1 {
     300px;
    height: 300px;
  }
</style>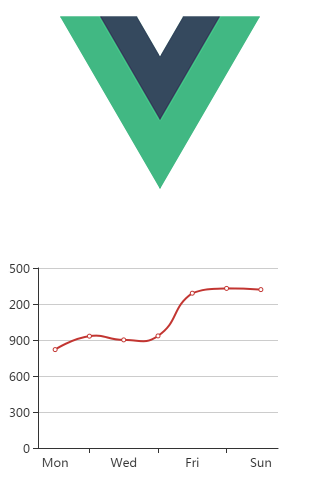
方式二、使用vue-echarts
先npm安装vue-echarts
npm install vue-echarts --save开发:
除了全量引用echarts,我们还可以采用按需引入的方式
main.js
import ECharts from 'vue-echarts/components/ECharts'
import 'echarts/lib/chart/line'
Vue.component('chart', ECharts)
HelloWorld.vue
<template>
  <div class="hello">
    <chart ref="chart1" :options="orgOptions" :auto-resize="true"></chart>
  </div>
</template>

<script>
export default {
  name: 'HelloWorld',
  data () {
    return {
      orgOptions: {},
    }
  },
  mounted() {
    this.orgOptions = {
        xAxis: {
            type: 'category',
            data: ['Mon', 'Tue', 'Wed', 'Thu', 'Fri', 'Sat', 'Sun']
        },
        yAxis: {
            type: 'value'
        },
        series: [{
            data: [820, 932, 901, 934, 1290, 1330, 1320],
            type: 'line',
            smooth: true
        }]
    }
  }
}
    </script>