绘制三维图:
mplot3d工具包提供了点、线、等值线、曲面和所有其他基本组件以及三维旋转缩放的三维绘图。
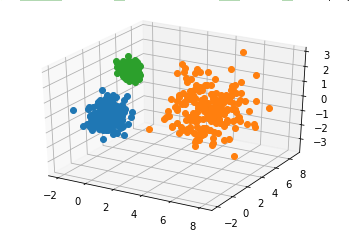
1.散点的三维数据图
from mpl_toolkits.mplot3d import axes3d #需要从mplot3d模块中导入axes 3D类型
import numpy as np
import matplotlib.pyplot as plt
fig=plt.figure()
ax=fig.gca(projection='3d') #通过将关键字projection='3d'应用到坐标轴对象上来实现三维绘图
class1=0.6*np.random.standard_normal((200,3))
ax.plot(class1[:,0],class1[:,1],class1[:,2],'o')
class2=1.2*np.random.standard_normal((200,3))+np.array([5,4,0])
ax.plot(class2[:,0],class2[:,1],class2[:,2],'o')
class3=0.3*np.random.standard_normal((200,3))+np.array([0,3,2])
ax.plot(class3[:,0],class3[:,1],class3[:,2],'o')
2. 表面图(Surface plots)
基本用法:ax.plot_surface(X,Y,Z,alpha=0.5)
X,Y,Z:数据 color:表明颜色 cmap:图层
示例:
from mpl_toolkits.mplot3d import axes3d
import numpy as np
import matplotlib.pyplot as plt
fig=plt.figure()
ax=fig.gca(projection='3d')
X,Y,Z=axes3d.get_test_data(0.05)
ax.plot_surface(X,Y,Z,alpha=0.5)

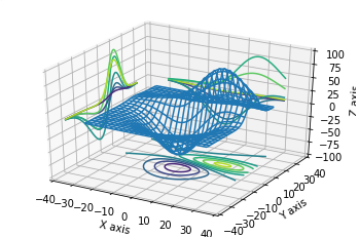
3. 线框图(Wireframe plots)
基本用法:ax.plot_wireframe(X, Y, Z, *args, **kwargs)
- X,Y,Z:输入数据
- rstride:行步长
- cstride:列步长
- rcount:行数上限
- ccount:列数上限
示例:
from mpl_toolkits.mplot3d import axes3d
import matplotlib.pyplot as plt
fig=plt.figure()
ax=fig.gca(projection='3d')
X,Y,Z=axes3d.get_test_data(0.05)
ax.plot_wireframe(X,Y,Z,rstride=5,cstride=5)
ax.contour(X,Y,Z,zdir='z',offset=-100) #等高线
ax.contour(X,Y,Z,zdir='x',offset=-40)
ax.contour(X,Y,Z,zdir='y',offset=40)
ax.set_xlim3d(-40,40) #设置坐标轴极限的标准
ax.set_ylim3d(-40,40)
ax.set_zlim3d(-100,100)
ax.set_xlabel('X axis') #设置标签的命令
ax.set_ylabel('Y axis')
ax.set_zlabel('Z axis')
#结果图:
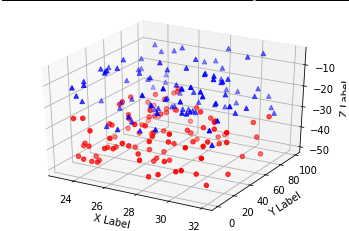
4. 散点绘制(Scatter plots)
基本用法:ax.scatter(xs, ys, zs, s=20, c=None, depthshade=True, *args, *kwargs)
- xs,ys,zs:输入数据;
- s:scatter点的尺寸
- c:颜色,如c = 'r'就是红色;
- depthshase:透明化,True为透明,默认为True,False为不透明
- *args等为扩展变量,如maker = 'o',则scatter结果为’o‘的形状
示例:
from mpl_toolkits.mplot3d import Axes3D
import matplotlib.pyplot as plt
import numpy as np
def randrange(n, vmin, vmax):
'''
Helper function to make an array of random numbers having shape (n, )
with each number distributed Uniform(vmin, vmax).
'''
return (vmax - vmin)*np.random.rand(n) + vmin
fig = plt.figure()
ax = fig.add_subplot(111, projection='3d')
n = 100
for c, m, zlow, zhigh in [('r', 'o', -50, -25), ('b', '^', -30, -5)]:
xs = randrange(n, 23, 32)
ys = randrange(n, 0, 100)
zs = randrange(n, zlow, zhigh)
ax.scatter(xs, ys, zs, c=c, marker=m)
ax.set_xlabel('X Label')
ax.set_ylabel('Y Label')
ax.set_zlabel('Z Label')
plt.show()
#结果图如下:
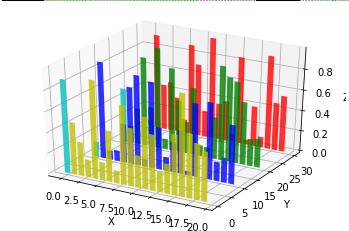
5.条形图(Bar plots)
基本方法:ax.bar(left, height, zs=0, zdir='z', *args, **kwargs
- x,y,zs = z,数据
- zdir:条形图平面化的方向,具体可以对应代码理解
示例:
from mpl_toolkits.mplot3d import Axes3D
import matplotlib.pyplot as plt
import numpy as np
fig = plt.figure()
ax = fig.add_subplot(111, projection='3d')
for c, z in zip(['r', 'g', 'b', 'y'], [30, 20, 10, 0]):
xs = np.arange(20)
ys = np.random.rand(20)
cs = [c] * len(xs)
cs[0] = 'c'
ax.bar(xs, ys, zs=z, zdir='y', color=cs, alpha=0.8)
ax.set_xlabel('X')
ax.set_ylabel('Y')
ax.set_zlabel('Z')
plt.show() #结果图: