一、.在div中使用CSS3动画,以overlay的形式添加
1.先为一个div创建css
[css] view plain copy print?
.css_animation{
        height:50px;
        50px;
        border-radius: 25px;
        background: rgba(255, 0, 0, 0.9);
        transform: scale(0);
        animation: myfirst 3s;
        animation-iteration-count: infinite;
    }

    @keyframes myfirst{
        to{
            transform: scale(2);
            background: rgba(0, 0, 0, 0);
        }
    }
2.动态创建这个div,并将这个div作为overlay的Element,添加到地图中
var point_div = document.createElement('div');
     point_div.className="css_animation";
     point_overlay = new ol.Overlay({
         element: point_div,
         positioning: 'center-center'
     });
     map.addOverlay(point_overlay);
如果需要添加到地图上,只需要设置
point_overlay.setPosition(coordinate);
二、使用openlayers3自带的postcompose事件
这个事件在地图渲染时都会触发,而我们只要改变地图上的某个feature或者layer或者其他任何东西,就会触发重新渲染。因此我们在postcompose中改变feature的样式,改变样式后重新触发postcompose事件,一只循环下去,形成动画效果。这里我们制作了一个闪烁的动画,代码如下:
var radius = 0;
  map.on('postcompose', function(){
      // 增大半径,最大30
      radius++;
      radius = radius%30;
      var color;
      if(radius <15){
          color = '#FF0000'
      }else{
          color = null
      }
      gpsPointLayer.setStyle(new ol.style.Style({
              image: new ol.style.Icon({
                  anchor: [0.5, 1],
                  src: 'IMG/online.png',
                  color: color
              })
          }));
  })
其中radius每次postcompose都会自增,用以控制样式改变的速度
下面代码跟上面代码实现的功能差不多
<div id="map" style=" 100%"></div>
<script type="text/javascript">
    var layer = new ol.layer.Vector({
        source: new ol.source.Vector()
    })
    var map = new ol.Map({
        layers: [
          new ol.layer.Tile({
            source: new ol.source.OSM()
          }),
          layer
        ],
        target: 'map',
        view: new ol.View({
          center: ol.proj.transform(
              [104, 30], 'EPSG:4326', 'EPSG:3857'),
          zoom: 10
        })
    });

    var circle = new ol.Feature({
        geometry: new ol.geom.Point(ol.proj.transform(
              [104, 30], 'EPSG:4326', 'EPSG:3857'))
    });
    circle.setStyle(new ol.style.Style({
        image: new ol.style.Circle({
            radius: 0,
            stroke: new ol.style.Stroke({
                color: 'red',
                size: 1
            })
        })
    }));
    layer.getSource().addFeature(circle);

    // 关键的地方在此:监听postcompose事件,在里面重新设置circle的样式
    var radius = 0;
    map.on('postcompose', function(){
        // 增大半径,最大20
        radius++;
        radius = radius % 20;
        // 设置样式
        circle.setStyle(new ol.style.Style({
            image: new ol.style.Circle({
                radius: radius,
                stroke: new ol.style.Stroke({
                    color: 'red',
                    size: 1
                })
            })
        }));
    })
</script>
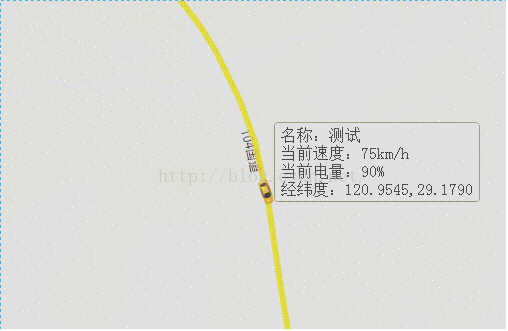
三、使用js的requestAnimationFrame
requestAnimationFrame的方式与其他的js中方法相比的优势如下:1.经过浏览器优化,动画更流畅2.窗口没激活时,动画将停止,省计算资源3.更省电,尤其是对移动终端。这里我们制作了一个轨迹回放的动画。代码如下:
var progress = 0;
    var moveFeature2 = function(){
        var speed = 200;
        progress += 1;
        if(progress%speed==0){
            var currentPoint = new ol.geom.Point(routeCoords[progress/speed]);
            var dx = routeCoords[progress/speed][0] - routeCoords[progress/speed-1][0];
            var dy = routeCoords[progress/speed][1] - routeCoords[progress/speed-1][1];
            var rotation = Math.atan2(dy, dx);
            var styleGeomarker = new ol.style.Style({
                image: new ol.style.Icon({
                    src: 'images/taxi.png',
                    rotateWithView: false,
                    rotation: -rotation
                })})
            var feature = new ol.Feature(currentPoint);
            vectorLayer2.getSource().clear();
            vectorLayer2.getSource().addFeature(feature);
            vectorLayer2.setStyle(styleGeomarker);
        }
        if(progress%speed!=0){
            var arcGenerator = new arc.GreatCircle(
                    {x: routeCoords[Math.floor(progress/speed)][0], y: routeCoords[Math.floor(progress/speed)][1]},
                    {x: routeCoords[Math.floor(progress/speed+1)][0], y: routeCoords[Math.floor(progress/speed+1)][1]});
            var arcLine = arcGenerator.Arc(speed, {offset: 0});//在两个点之间生成100个点 js地址为https://api.mapbox.com/mapbox.js/plugins/arc.js/v0.1.0/arc.js
            var line = new ol.geom.LineString(arcLine.geometries[0].coords);
            var lineFeature = new ol.Feature({
                type: 'route',
                geometry: line
            });
            var currentPoint = new ol.geom.Point(arcLine.geometries[0].coords[progress%speed]);
            var dx = arcLine.geometries[0].coords[progress%speed][0] - arcLine.geometries[0].coords[progress%speed-1][0];
            var dy = arcLine.geometries[0].coords[progress%speed][1] - arcLine.geometries[0].coords[progress%speed-1][1];
            var rotation = Math.atan2(dy, dx);
            var styleGeomarker = new ol.style.Style({
                image: new ol.style.Icon({
                    src: 'images/taxi.png',
                    rotateWithView: false,
                    rotation: -rotation
                })})
            var feature = new ol.Feature(currentPoint);
            vectorLayer2.getSource().clear();
            vectorLayer2.getSource().addFeature(feature);
            helpTooltipElement.innerHTML="名称:测试"+"\<br\>"
                    +"当前速度:75km/h"+"\<br\>"
                    +"当前电量:90%"+"\<br\>"
                    +"经纬度:"+(arcLine.geometries[0].coords[progress%100][0]+"").substring(0,8)+","+(arcLine.geometries[0].coords[progress%100][1]+"").substring(0,7);
            helpTooltip.setPosition(arcLine.geometries[0].coords[progress%100]);
        }
        if (progress/speed < routeLength-1) {
            requestAnimationFrame(moveFeature2);
        }
    }
此处涉及openlayers3中弹出框overlay、layer、feature、style,还有一个外部引用的工具js(地址文中已给出)以及requestAnimationFrame,细节不再叙述,效果如下,下班了。。。
此处涉及openlayers3中弹出框overlay、layer、feature、style,还有一个外部引用的工具js(地址文中已给出)以及requestAnimationFrame,细节不再叙述
OpenLayers 3内置的动画效果,代码如下:
<div id="map" style=" 100%"></div>
<!--增加两个按钮,一个演示不带动画,一个演示带动画-->
<input type="button" value="回到原点-不带动画" onclick="backNoAnim()"></input>
<input type="button" value="回到原点-带动画" onclick="backWithAnim()"></input>
<script type="text/javascript">
    var map = new ol.Map({
        layers: [
          new ol.layer.Tile({
            source: new ol.source.OSM()
          })
        ],
        target: 'map',
        view: new ol.View({
          center: ol.proj.transform(
              [104, 30], 'EPSG:4326', 'EPSG:3857'),
          zoom: 10
        })
    });

    // 不带动画的实现
    function backNoAnim() {
    map.getView().setCenter(ol.proj.transform([104, 30], 'EPSG:4326', 'EPSG:3857'));
    }

    // 带动画的实现
    function backWithAnim() {
        // 注意: 应用内置的动画,实现平移动画
        var pan = ol.animation.pan({
      duration: 2000,
      source: map.getView().getCenter()
    });
    // 注意: 使用beforeRender来添加
    map.beforeRender(pan);
    // 然后才是重新设置地图中心点到原来的位置
    map.getView().setCenter(ol.proj.transform([104, 30], 'EPSG:4326', 'EPSG:3857'));
    }

</script>
关键的代码始终在最后,结合注释,应该可以理解。 我们使用的内置动画是ol.animation.pan,用于平移动画,更详细的信息请参考官网API。 可以看到它是一个函数,返回一个ol.PreRenderFunction,添加到ol.Map,从而在渲染的时候使用,实现动画。
除了上面应用的动画之外,还有一些内置的动画,都在ol.animation里面,从官网API可以看到,包括:
ol.animation.bounce: 来回弹。ol.animation.pan: 平移。ol.animation.rotate: 旋转。ol.animation.zoom: 缩放。- 虽然内置动画并不多,但是细心的同学已经发现了内置动画有个参数
easing,这是一个强大的参数,因为可以让开发者自定义动画实现,从而实现动画效果的扩展。 其实已经内置了一些相关的实现,在ol.easing里面,涉及到一些常用的效果,包括: ol.easing.easeIn: 加速ol.easing.easeOut: 减速ol.easing.inAndOut: 先加速再减速ol.easing.linear: 匀速ol.easing.upAndDown: 和inAndOut类似-
<div id="map" style=" 100%"></div>
<!--添加动画效果选择项-->
<select id = "easing-type">
    <option>easeIn</option>
    <option>easeOut</option>
    <option>inAndOut</option>
    <option>linear</option>
    <option>upAndDown</option>
</select>
<input type="button" value="回到原点" onclick="backWithAnim()"></input>
<script type="text/javascript">
    var map = new ol.Map({
        layers: [
          new ol.layer.Tile({
            source: new ol.source.OSM()
          })
        ],
        target: 'map',
        view: new ol.View({
          center: ol.proj.transform(
              [104, 30], 'EPSG:4326', 'EPSG:3857'),
          zoom: 10
        })
    });

    // 根据选择项,返回对应的动画,供下面的backWithAnim函数使用
    function getEasing() {
        var typeSelect = document.getElementById('easing-type');
        var easing = typeSelect.options[typeSelect.selectedIndex].text;
        if (easing === 'easeIn') {
            return ol.easing.easeIn;
        } else if (easing === 'easeOut') {
            return ol.easing.easeOut;
        } else if (easing === 'inAndOut') {
            return ol.easing.inAndOut;
        } else if (easing === 'linear') {
            return ol.easing.linear;
        } else if (easing === 'upAndDown') {
            return ol.easing.upAndDown;
        }
    }

    function backWithAnim() {
        var pan = ol.animation.pan({
      duration: 2000,
      source: map.getView().getCenter(),
      easing: getEasing()    // 设置对应选择的动画
    });
    map.beforeRender(pan);
    map.getView().setCenter(ol.proj.transform([104, 30], 'EPSG:4326', 'EPSG:3857'));
    }

</script>
通过上面这种方法,我们完全可以自定义动画函数,通过官网API文档可知,这些函数有一个参数
t,范围在0-1之间,然后函数返回一个0-1之间的数。 结合动画业务来看,虽然官网没有说明参数表示什么意思,但是我们可以猜测它就是时间,返回的值应该目标达成比。 下面我们自己来实现一个sin曲线式的动画:
<div id="map2" style=" 100%"></div>
<input type="button" value="回到原点" onclick="backWithAnim2();"></input>
<script type="text/javascript">
    var map2 = new ol.Map({
        layers: [
          new ol.layer.Tile({
            source: new ol.source.OSM()
          })
        ],
        target: 'map2',
        view: new ol.View({
          center: ol.proj.transform(
              [104, 30], 'EPSG:4326', 'EPSG:3857'),
          zoom: 10
        })
    });

    // sin曲线动画
    function sin(t) {
        // 使用sin曲线公式
        return Math.sin(t * Math.PI / 2);
    }

    function backWithAnim2() {
        var pan = ol.animation.pan({
      duration: 2000,
      source: map2.getView().getCenter(),
      easing: sin // 应用sin曲线动画
    });
    map2.beforeRender(pan);
    map2.getView().setCenter(ol.proj.transform([104, 30], 'EPSG:4326', 'EPSG:3857'));
    }

</script>