• 使用Echarts实现折线图的一点总结


    使用Echarts的一点总结

    1.安装,我使用得vue

      cnpm install echarts --save

    2.在入口文件main.js中注册,并使用

    // 引入折线图 echarts
    import echarts from 'echarts'
    Vue.prototype.$echarts = echarts

    3.在需要使用折线图的模块使用

    3.1 html部分,给定一个div

     <div id="sleep" class="zonghe"></div>

    3.2 js部分

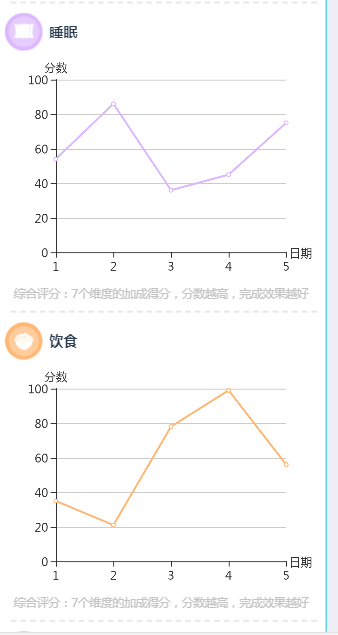
     // 睡眠
        sleep() {
          // 基于准备好的dom,初始化echarts实例
          let sleep = this.$echarts.init(document.getElementById("sleep"));
          // 绘制图表
          sleep.setOption({
            tooltip: {},
            xAxis: {
              name: "日期",
              nameLocation: "end",
              nameTextStyle: {
                padding: -12
              },
              data: ["1", "2", "3", "4", "5"],
              type: "category",
              boundaryGap: false
            },
            color: ["#dcb7fe"],
            yAxis: {
              type: "value",
              name: "分数",
              nameLocation: "end",
              nameTextStyle: {
                padding: -8
              }
            },
            series: [
              {
                data: [54, 86, 36, 45, 75],
                type: "line"
              }
            ]
          });
        },

    3.3 css部分

    .zonghe {
      width: 6rem;
      height: 6rem;
      font-size: 0.15rem;
      color: rgb(179, 179, 179);
      margin-left: 0.46rem;
      margin-right: 0.46rem;
      margin-top: -0.6rem;
    }

    4.最后实现效果

    已经没有了哦!thank you!

  • 相关阅读:
    flask 数据迁移
    docker daemon 配置代理
    dbcm with kubenetes
    curl 访问 k8s
    kubernetes 集群安全配置
    k8s dashboard
    k8s v1.5.8 单节点搭建
    etcd raft library
    split files test
    ubuntu两个python版本共存并切换默认版本
  • 原文地址:https://www.cnblogs.com/cb1490838281/p/9685792.html
Copyright © 2020-2023  润新知