rrdtool 实践
rrdtool 参数比较多,如果直接看文档,不知从何入手,直接从例子入手这样容易理解,模拟网卡流量
1. 创建数据库
rrdtool create Flow.rrd --start $(date +%s) --step 1
DS:eth0_in:GAUGE:1:0:U
DS:eth0_out:GAUGE:1:0:U
RRA:LAST:0.5:1:2
RRA:LAST:0.5:1:4
RRA:AVERAGE:0.5:1:600
RRA:AVERAGE:0.5:6:700
RRA:MAX:0.5:1:600
RRA:MAX:0.5:444:797
2. 更新数据(模拟流量数据)
import sys,os
import time
import random
import rrdtool

total_input_traffic = 0
total_output_traffic = 0
starttime=int(time.time())
for i in range(100000):
    total_input_traffic = random.randrange(0, 5000)
    total_output_traffic = random.randrange(0, 5000)
    os.system("rrdtool updatev Flow.rrd"+str(starttime)+":"+str(total_input_traffic)+":"+str(total_output_traffic))
    starttime += 1
    time.sleep(1)
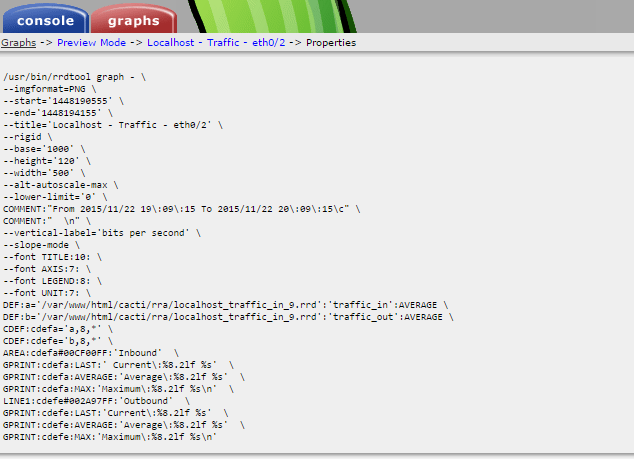
3.绘图(参考cacti的绘制)
rrdtool graph Flow.png
--imgformat=PNG
--start -1h
--title='Localhost - Traffic - eth0'
--rigid
--base='1000'
--height='120'
--width='500'
--alt-autoscale-max
--lower-limit='0'
DEF:a=Flow.rrd:eth0_in:AVERAGE
DEF:b=Flow.rrd:eth0_out:AVERAGE
--vertical-label='bits per second'
--slope-mode
--font TITLE:10:
--font AXIS:7:
--font LEGEND:8:
--font UNIT:7:
CDEF:cdefa='a,8,*'
CDEF:cdefe='b,8,*'
AREA:cdefa#00CF00FF:'Inbound'
GPRINT:cdefa:LAST:' Current:%8.2lf %s'
GPRINT:cdefa:AVERAGE:'Average:%8.2lf %s'
GPRINT:cdefa:MAX:'Maximum:%8.2lf %s
'
LINE1:cdefe#002A97FF:'Outbound'
GPRINT:cdefe:LAST:'Current:%8.2lf %s'
GPRINT:cdefe:AVERAGE:'Average:%8.2lf %s'
GPRINT:cdefe:MAX:'Maximum:%8.2lf %s
'

绘制是参考cacti的绘制的,基本未做修改:

参考:http://book.51cto.com/art/201411/456743.htm
参考:http://im.nuk.edu.tw/~lee/rrdtool/index.htm
参考:http://blog.liuts.com/post/215/
参考:http://www.cnblogs.com/coldplayerest/archive/2010/02/09/1666413.html
参考:http://bbs.chinaunix.net/forum.php?mod=viewthread&tid=864861&page=1