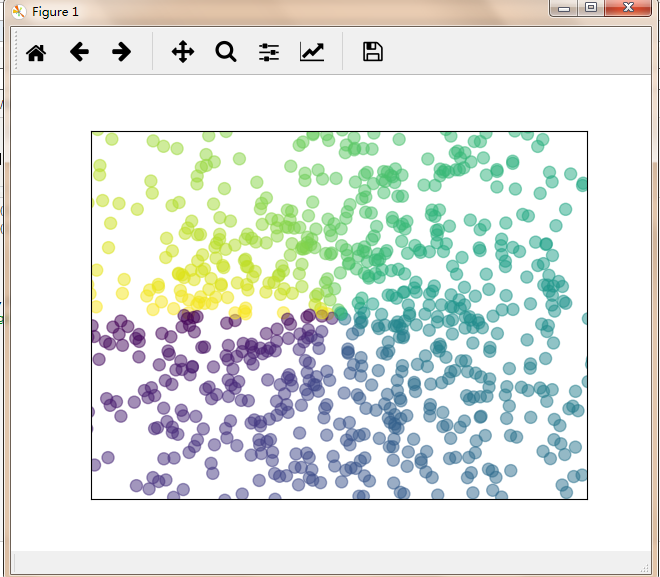
散点图
import matplotlib.pyplot as plt
import numpy as np


#n个点
n = 1024
#平均值是0,方差是1
X = np.random.normal(0,1,n)
Y = np.random.normal(0,1,n)
#确定颜色
T = np.arctan2(Y,X)

plt.scatter(X,Y,s=75,c=T,alpha=0.5)
#plt.scatter(np.arange(5),np.arange(5))


plt.xlim(-1.5,1.5)
plt.ylim(-1.5,1.5)

#隐藏所有的ticks
plt.xticks(())
plt.yticks(())


plt.show()
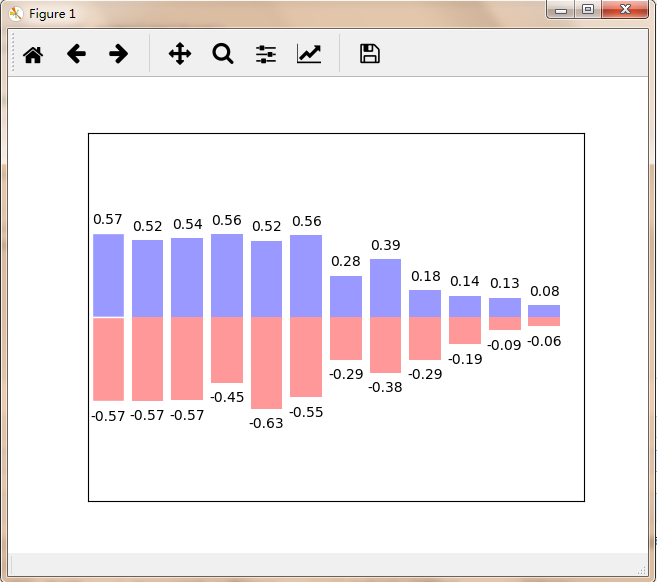
柱状图:
import matplotlib.pyplot as plt
import numpy as np

#12个柱状图
n=12
X = np.arange(n)#x会生成0到11
Y1 = (1-X/float(n))*np.random.uniform(0.5, 1.0, n)#随机随机生成0.5到1的数
Y2 = (1-X/float(n))*np.random.uniform(0.5, 1.0, n)

plt.bar(X,+Y1,facecolor='#9999ff',edgecolor='white')
plt.bar(X,-Y2,facecolor='#ff9999',edgecolor='white')


#zip是把X,Y1中的值分别给x和y
#plt.text(x位置,y位置,值)
for x,y in zip(X,Y1):
    #ha:horizontal alignment对齐方式
    plt.text(x,y+0.05,'%.2f' % y,ha='center',va='bottom')

for x,y in zip(X,Y2):
    #ha:horizontal alignment对齐方式
    plt.text(x,-y-0.05,'-%.2f' % y,ha='center',va='top')

plt.xlim(-.5,n)
plt.xticks(())
plt.ylim(-1.25,1.25)
plt.yticks(())
plt.show()
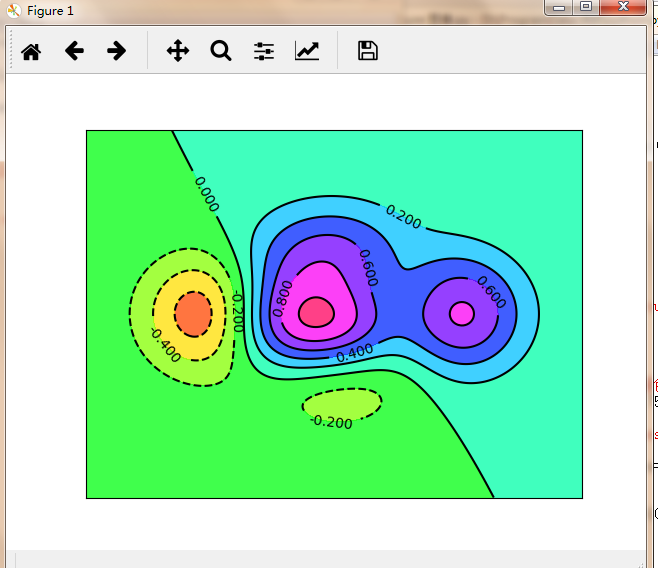
等高线
import matplotlib.pyplot as plt
import numpy as np

#通过x,y计算高度
def f(x,y):
    return (1-x/2+x**5+y**3)*np.exp(-x**2-y**2)


n=256
x=np.linspace(-3,3,n)
y=np.linspace(-3,3,n)

#把x,y绑定成网格的输入值
X,Y = np.meshgrid(x,y)

# use plt.contourf to filling contours
#X,Y and value for (X,Y) point
#contour为网格
#8代表分成10部分
#0分成2部分
#plt.cm.cool为冷色调,plt.cm.hot为暖色调,plt.cm.Spectral,plt.cm.hsv,plt.cm.ocean
plt.contourf(X,Y,f(X,Y),8,alpha=0.75,cmap=plt.cm.hsv)#画上颜色

#use plt.contour to add contounlines
#画线,contour为等高线的线
C = plt.contour(X,Y,f(X,Y),8,colors='black',linwidth=.5)

#adding label
plt.clabel(C,inline=True,fontsize=10)


plt.xticks(())
plt.yticks(())
plt.show()
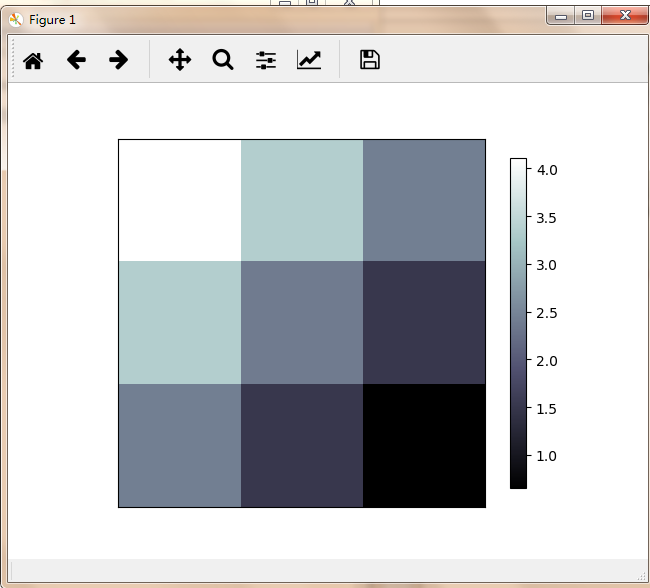
图像
import matplotlib.pyplot as plt
import numpy as np

#image data
a = np.array([4.11360827978,3.365348418405,2.423766120134,
              3.365248418405,2.39599930621,1.525083754405,
              2.423733120134,1.525083754405,0.651536351379]).reshape(3,3)


plt.imshow(a,interpolation='nearest',cmap='bone',origin='upper')
plt.colorbar(shrink=0.9)#shrink压缩,0.9压缩90%

plt.xticks(())
plt.yticks(())
plt.show()
本知识学于 莫烦python