img: 待检测的图像。
threshold: 阈值,可先项,默认为10
line_length: 检测的最短线条长度,默认为50
line_gap: 线条间的最大间隙。增大这个值可以合并破碎的线条。默认为10
返回:
lines: 线条列表, 格式如((x0, y0), (x1, y0)),标明开始点和结束点。
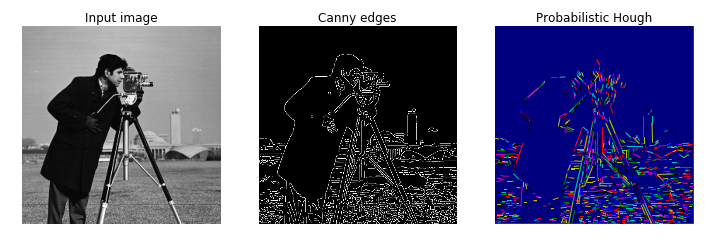
下面,我们用canny算子提取边缘,然后检测哪些边缘是直线?
import skimage.transform as st
import matplotlib.pyplot as plt
from skimage import data,feature

#使用Probabilistic Hough Transform.
image = data.camera()
edges = feature.canny(image, sigma=2, low_threshold=1, high_threshold=25)
lines = st.probabilistic_hough_line(edges, threshold=10, line_length=5,line_gap=3)

# 创建显示窗口.
fig, (ax0, ax1, ax2) = plt.subplots(1, 3, figsize=(16, 6))
plt.tight_layout()

#显示原图像
ax0.imshow(image, plt.cm.gray)
ax0.set_title('Input image')
ax0.set_axis_off()

#显示canny边缘
ax1.imshow(edges, plt.cm.gray)
ax1.set_title('Canny edges')
ax1.set_axis_off()

#用plot绘制出所有的直线
ax2.imshow(edges * 0)
for line in lines:
    p0, p1 = line
    ax2.plot((p0[0], p1[0]), (p0[1], p1[1]))
row2, col2 = image.shape
ax2.axis((0, col2, row2, 0))
ax2.set_title('Probabilistic Hough')
ax2.set_axis_off()
plt.show()

