- 性能测量
在很多情况之下,通过分析代码是很难确定某个模块性能好坏的。请看下面的例子,你觉得哪一个函数性能最优?
 1 //斐波那契数
 2 package fib
 3
 4 import "math"
 5
 6 //递归方式
 7 func Fib(n int) int {
 8     if n < 2 {
 9         return n
10     }
11     return Fib(n-1) + Fib(n-2)
12 }
13
14 //迭代方式
15 func Fib2(n int) int {
16     if n < 2 {
17         return n
18     }
19     a := 1
20     b := 1
21     c := 1
22     for i := 2; i < n; i++ {
23         c =  a + b
24         a = b
25         b = c
26     }
27     return c;
28 }
29
30 //公式求解
31 func Fib3(n int) int {
32     gh5 := math.Sqrt(5)
33     pow := math.Pow
34     f := (float64)(n)
35     return (int)(math.Ceil((pow(1+gh5, f) - pow(1-gh5,f)) / (pow(2.0, f) * gh5)))
36 }
上面的代码提供了3种求斐波那契数的方法,毫无疑问第一种方式是最不可取的。但是第二种和第三种方式到底哪一个性能更好呢?好多人可能会说是第三种。口说无凭,写个测试用例看看:
 1 package fib_test
 2
 3 import (
 4     "testing"
 5     "goperformance/fib"
 6 )
 7
 8 func Test_Fib(t *testing.T) {
 9     println(fib.Fib(40))
10 }
11
12 func Test_Fib2(t *testing.T)  {
13     println(fib.Fib2(40))
14 }
15
16 func Test_Fib3(t *testing.T)  {
17     println(fib.Fib3(40))
18 }
19
20 func Benchmark_Fib(b *testing.B) {
21     for i := 0; i < b.N; i++ {
22         fib.Fib(i%40)
23     }
24 }
25
26 func Benchmark_Fib2(b *testing.B) {
27     for i := 0; i < b.N; i++ {
28         fib.Fib2(i%40)
29     }
30 }
31
32 func Benchmark_Fib3(b *testing.B) {
33     for i := 0; i < b.N; i++ {
34         fib.Fib3(i%40)
35     }
36 }
执行 #go test -bench=. -v
 1 === RUN   Test_Fib
 2 102334155
 3 --- PASS: Test_Fib (0.63s)
 4 === RUN   Test_Fib2
 5 102334155
 6 --- PASS: Test_Fib2 (0.00s)
 7 === RUN   Test_Fib3
 8 102334155
 9 --- PASS: Test_Fib3 (0.00s)
10 PASS
11 Benchmark_Fib-4              100          20280130 ns/op
12 Benchmark_Fib2-4        100000000               13.4 ns/op
13 Benchmark_Fib3-4        10000000               123 ns/op
14 ok      goperformance/fib       6.086s
很明显第二种方式比第三种方式要快100多倍。性能测量为我们编写高性能的go程序提供了可靠的依据。
-
性能分析
1,使用标准库runtime/pprof
 1 package main
 2
 3 import (
 4     "goperformance/fib"
 5     "flag"
 6     "log"
 7     "os"
 8     "runtime/pprof"
 9 )
10
11 var cpuprofile = flag.String("cpuprofile", "cpu.prof", "write cpu profile to file")
12
13 func main() {
14     flag.Parse()
15     f, err := os.Create(*cpuprofile)
16     if err != nil {
17         log.Fatal(err)
18     }
19     pprof.StartCPUProfile(f)
20     defer pprof.StopCPUProfile()
21     println(fib.Fib(40))
22     println(fib.Fib2(40))
23     println(fib.Fib3(40))
24 }
编译并执行程序获得性能分析文件
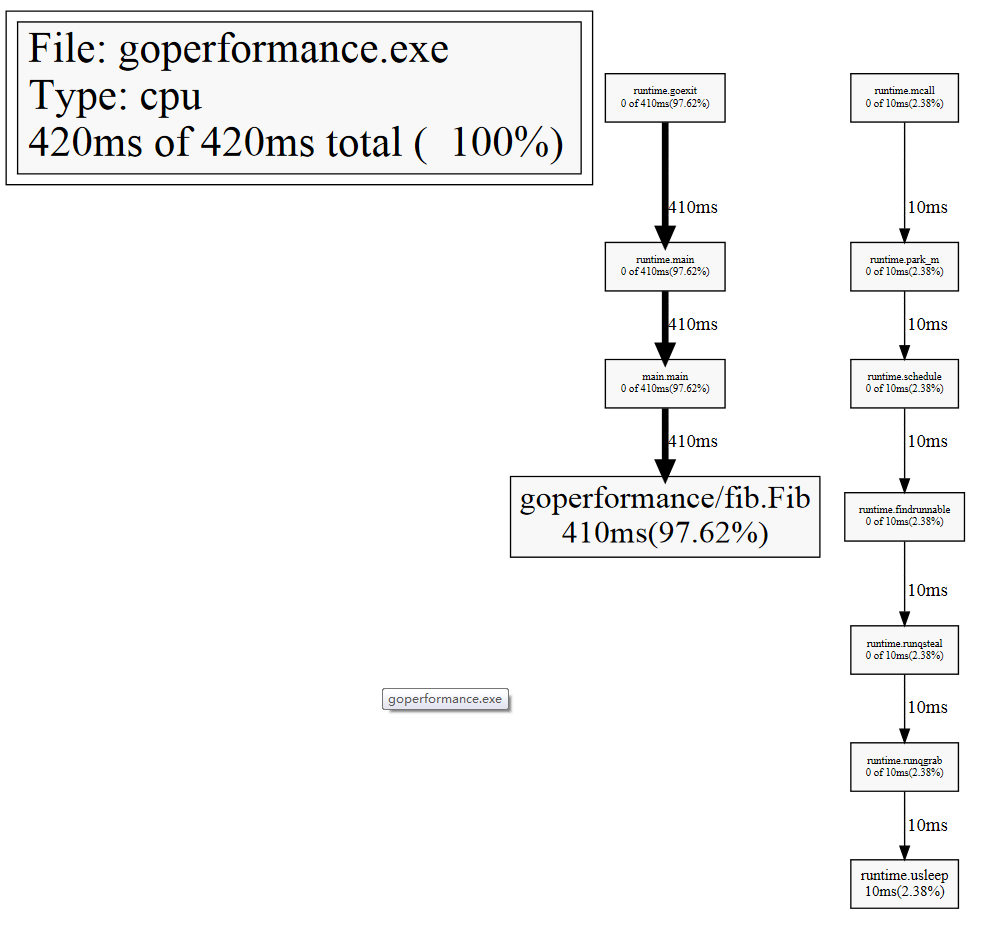
1 srcgoperformance>go build
2 srcgoperformance>goperformance.exe
3 102334155
4 102334155
5 102334155
6 srcgoperformance>go tool pprof goperformance.exe cpu.prof
7 Entering interactive mode (type "help" for commands)
8 (pprof) web
9 (pprof)
在web中展示出来的分析结果如下:
2,使用github.com/pkg/profile
profile包实际上是对runtime/pprof的封装,使用起来更加友好
 1 package main
 2
 3 import (
 4     "goperformance/fib"
 5     "github.com/pkg/profile"
 6 )
 7
 8 func main() {
 9     defer profile.Start().Stop() //可以通过不同的参数确定是cpu性能分析还是内存使用分析
10     println(fib.Fib(40))
11     println(fib.Fib2(40))
12     println(fib.Fib3(40))
13 }
运行程序后在缓存自动生成一个临时文件,这个文件就是上一种方式中的cpu.prof文件。接下来的操作就和第一种方式一样。