Variance(方差)
衡量随机变量或一组数据的 离中 的离散程度
引入例子
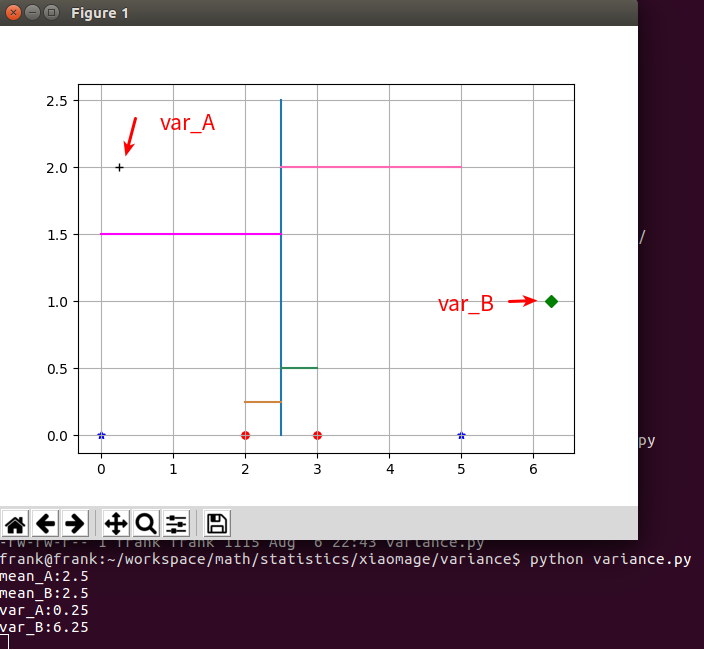
假设有两组总体:A={2,2,3,3}, B={0,0,5,5}
显然,(mu)并不能反映这两组数据集的差异。
数据集A:$ Var[A]=frac { displaystyle sum_{i=1}^N (x_i - mu)^2}{N}=frac{0.25 cdot 4}{4}=0.25$
| i | (x_i) | (mu) | (x_i-mu) | ((x_i-mu)^2) |
|---|---|---|---|---|
| 1 | (x_1=2) | 2.5 | -0.5 | 0.25 |
| 2 | (x_1=2) | 2.5 | -0.5 | 0.25 |
| 3 | (x_1=3) | 2.5 | 0.5 | 0.25 |
| 4 | (x_1=3) | 2.5 | 0.5 | 0.25 |
数据集B:$ Var[B]=frac { displaystyle sum_{i=1}^N (x_i - mu)^2}{N}=frac{6.25 cdot 4}{4}=6.25$
| i | (x_i) | (mu) | (x_i-mu) | ((x_i-mu)^2) |
|---|---|---|---|---|
| 1 | (x_1=0) | 2.5 | -2.5 | 6.25 |
| 2 | (x_1=0) | 2.5 | -2.5 | 6.25 |
| 3 | (x_1=5) | 2.5 | 2.5 | 6.25 |
| 4 | (x_1=5) | 2.5 | 2.5 | 6.25 |
从上面两组数据集可以看出,尽管两组数据集 期望 相同,但是,方差并不相同。数据集A 表现得更集中,而数据集B 表现得相对分散。
定义
In probability theory and statistics, variance is the expectation of the squared deviation of a random variable from its mean. Informally, it measures how far a set of (random) numbers are spread out from their average value. Variance has a central role in statistics, where some ideas that use it include descriptive statistics, statistical inference, hypothesis testing, goodness of fit, and Monte Carlo sampling. Variance is an important tool in the sciences, where statistical analysis of data is common. The variance is the square of the standard deviation, the second central moment of a distribution, and the covariance of the random variable with itself, and it is often represented by (displaystyle sigma ^{2}),(displaystyle s^{2}) , or (displaystyle operatorname {Var} (X)).
在概率论和统计学中,方差的定义: 随机变量与期望的差 的平方值 的期望,衡量随机变量与其期望的偏离程度。
表示符号
(displaystyle sigma ^{2}):一般表示总体的方差
(displaystyle s^{2}): 一般表示抽样分布的方差
(displaystyle operatorname {Var} (X))
公式
The variance of a random variable (displaystyle X) is the expected value of the squared deviation from the mean of (displaystyle X) , (displaystyle mu =operatorname {E} [X]):
对于离散型随机变量,方差的公式:
If the generator of random variable (displaystyle X) is discrete with probability mass function (displaystyle x_{1}mapsto p_{1},x_{2}mapsto p_{2},ldots ,x_{n}mapsto p_{n}) then
对于连续型随机变量,方差的公式:
#!/usr/bin/env python3
#-*- coding:utf-8 -*-
#############################################
#File Name: variance.py
#Brief:
#Author: frank
#Email: frank0903@aliyun.com
#Created Time:2018-08-06 22:40:11
#Blog: http://www.cnblogs.com/black-mamba
#Github: https://github.com/xiaomagejunfu0903/statistic_notes
#############################################
import numpy as np
import matplotlib.pyplot as plt

A = [2, 2, 3, 3]
B = [0, 0, 5, 5]

mean_A = np.mean(A)
print("mean_A:{}".format(mean_A))
mean_B = np.mean(B)
print("mean_B:{}".format(mean_B))

var_A = np.var(A)
print("var_A:{}".format(var_A))
var_B = np.var(B)
print("var_B:{}".format(var_B))

y_A = [0,0,0,0]
plt.scatter(A,y_A,c='r',s=25,marker='o')
plt.scatter(B,y_A,c='b',s=25,marker='*')
plt.plot(var_A, 2, 'k+')
#A_handle, = plt.plot((var_A,mean_A), (2,2))
plt.plot((var_B), (1), 'gD')
#A_handle, = plt.plot((var_B,mean_B), (1,1))

plt.plot((mean_A,mean_A),(0.0,2.5))#均值线

plt.plot((2,mean_A),(0.25,0.25),'peru')
plt.plot((3,mean_A),(0.50,0.50),'seagreen')

plt.plot((0,mean_B),(1.5,1.5),'magenta')
plt.plot((5,mean_B),(2.0,2.0),'hotpink')

plt.grid(True)
plt.show()