1.环境准备
py版本:python3.6.7
需要使用的包列表文件: requirements.txt
certifi==2018.10.15
chardet==3.0.4
cycler==0.10.0
idna==2.7
jieba==0.39
kiwisolver==1.0.1
matplotlib==3.0.1
numpy==1.15.4
pandas==0.23.4
Pillow==5.3.0
pyparsing==2.3.0
python-dateutil==2.7.5
pytz==2018.7
requests==2.20.1
scipy==1.1.0
six==1.11.0
urllib3==1.24.1
wordcloud==1.5.0
制作词云的图片一张:cloud.jpg

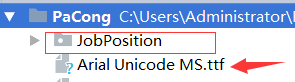
创建一个目录:JobPostion 用来存放爬取的csv文件格式的数据
用来解决词云中的乱码的字体文件 Arial Unicode MS.ttf
2.爬取拉勾数据代码
#!/usr/bin/python
# -*- coding: utf-8 -*-
# @Time    : 2018/11/16/016 21:44
# @Author  : BenjaminYang
# @FileName: lagou.py
# @Software: PyCharm
# @Blog    :http://cnblogs.com/benjamin77

import requests
import math
import time
import pandas as pd

def get_json(url, num):
   '''从网页获取JSON,使用POST请求,加上头部信息'''
   headers = {
       'User-Agent': 'Mozilla/5.0 (Windows NT 10.0; Win64; x64) AppleWebKit/537.36 (KHTML, like Gecko) Chrome/66.0.3359.139 Safari/537.36',
       'Host': 'www.lagou.com',
       'Referer':'https://www.lagou.com/jobs/list_python%E5%BC%80%E5%8F%91?labelWords=&;fromSearch=true&suginput=',
       'X-Anit-Forge-Code': '0',
       'X-Anit-Forge-Token': 'None',
      'X-Requested-With': 'XMLHttpRequest'
   }


   data = {
       'first': 'true',
       'pn': num,
       'kd': '运维工程师'}
   res = requests.post(url, headers=headers, data=data)
   res.raise_for_status()
   res.encoding = 'utf-8'
   # 得到包含职位信息的字典
   page = res.json()
   return page

def get_page_num(count):
    '''通过岗位总数与除以每页显示数15,如果超过17页就显示17页,不超过就显示计算的页数'''
    res=math.ceil(count/15)
    if res >17:
        return 17
    else:
        return res

def get_page_info(jobs_list):
    page_info_list = []
    for i in jobs_list:
        job_info = []
        job_info.append(i['companyFullName'])        # 公司全名
        job_info.append(i['companyShortName'])       # 公司简称
        job_info.append(i['companySize'])             # 公司规模
        job_info.append(i['financeStage'])            # 融资阶段
        job_info.append(i['district'])                 # 区域
        job_info.append(i['positionName'])            # 职位名称
        job_info.append(i['workYear'])                 # 工作经验
        job_info.append(i['education'])                # 学历要求
        job_info.append(i['salary'])                   # 工资
        job_info.append(i['positionAdvantage'])       # 职位福利
        page_info_list.append(job_info)
    return page_info_list


if __name__=='__main__':
    url='https://www.lagou.com/jobs/positionAjax.json?city=%E6%9D%AD%E5%B7%9E&needAddtionalResult=false'
    page_one=get_json(url,1)#获取一页的json数据
    total_count=page_one['content']['positionResult']['totalCount']#岗位总数
    num=get_page_num(total_count)#当前总页数
    print('职位总数:{},当前总页数:{}'.format(total_count,num))
    time.sleep(20)
    print(page_one)

    total_info=[]
    for n in range(1,num+1):#获取每一页的json数据
        page =get_json(url,n)
        jobs_list=page_one['content']['positionResult']['result']
        page_info=get_page_info(jobs_list)
        total_info+=page_info
        time.sleep(30)
    df=pd.DataFrame(data=total_info,columns=['公司全名','公司简称','公司规模','融资阶段','区域','职位名称','工作经验','学历要求','工资','职位福利'])
    df.to_csv('./JobPosition/运维工程师.csv',index=False)
    print('已保存csv文件')
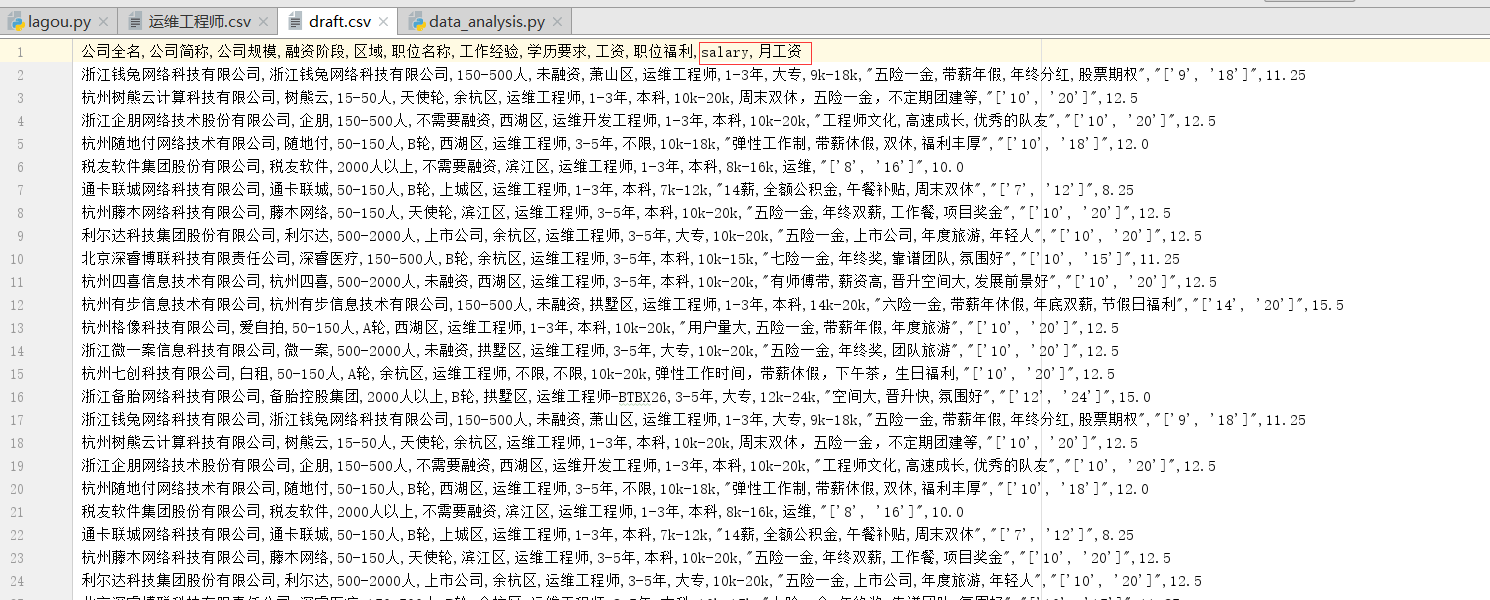
执行完会在 JobPostion目录下生成一个 csv文件


3.绘图代码
#!/usr/bin/python
# -*- coding: utf-8 -*-
# @Time    : 2018/11/17/017 13:39
# @Author  : BenjaminYang
# @FileName: data_analysis.py
# @Software: PyCharm
# @Blog    :http://cnblogs.com/benjamin77

import pandas as pd
import matplotlib
import matplotlib.pyplot as plt
from wordcloud import WordCloud
from scipy.misc import imread
import jieba
from pylab import mpl


#设置字体样式
mpl.rcParams['font.family']='sans-serif'
mpl.rcParams['font.sans-serif']='simhei'

# 1.计算薪资,生成直方图,25%
def get_salary_chart(df):
    df['salary']=df['工资'].str.findall('d+')
    avg_salary=[]
    for k in df['salary']:
        int_list=[int(n) for n in k]
        # 10k-16k  正常要工资是 10+(16-10)/4=11.5
        avg_wage=int_list[0]+(int_list[1]-int_list[0])/4
        avg_salary.append(avg_wage)
    df['月工资']=avg_salary
    df.to_csv('draft.csv',index=False)

    print('岗位工资比例:
{}'.format(df['月工资'].describe()))


    plt.xticks(fontsize=12)
    plt.yticks( fontsize=12)
    plt.xlabel('工资(K)', fontsize=14)
    plt.ylabel('次数', fontsize=14)
    plt.hist(df['月工资'],bins=12)
    plt.title(filename+'薪资直方图', fontsize=14)
    plt.savefig('histogram.jpg')
    plt.show()

    #饼图
def get_region_chart():
    count=df['区域'].value_counts()
    print(count)
    plt.pie(count,labels=count.keys(),labeldistance=1.4,autopct='%2.1f%%')
    plt.axis('equal')
    plt.title(filename+'岗位区域分布图', fontsize=14 )
    plt.legend(loc='upper left',bbox_to_anchor=(-0.1,1))
    plt.savefig('pie_chart.jpg')
    plt.show()

def get_cloud_chart():
    text = ''
    for line in df['职位福利']:
        text += line

    # 5.1 使用jieba模块将字符串分割为单词列表
    cut_text = ' '.join(jieba.cut(text))  # 字符串分词
    cloud = WordCloud(
        font_path='Arial Unicode MS.ttf',
        background_color='white',  # 背景设置成(white)白色
        mask=imread('./cloud.jpg'),  # 设置背景图
        max_words=1000,
        max_font_size=100
    )

    word_cloud = cloud.generate(cut_text)
    # 5.2 保存词云图片
    word_cloud.to_file('word_cloud.jpg')
    plt.imshow(word_cloud)
    plt.axis('off')
    plt.show()

if __name__ == '__main__':
    filename='运维工程师'
    f=open('./JobPosition/'+filename+'.csv',encoding='utf-8')
    df=pd.read_csv(f)
    get_salary_chart(df)
    get_region_chart()
    get_cloud_chart()
4.效果展示
4.1draft.csv
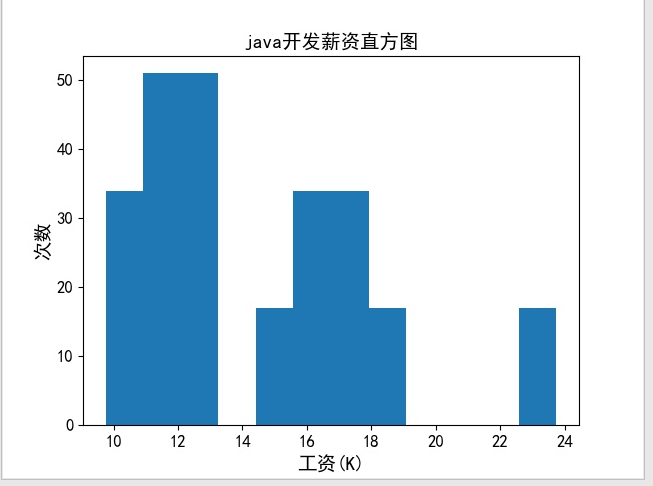
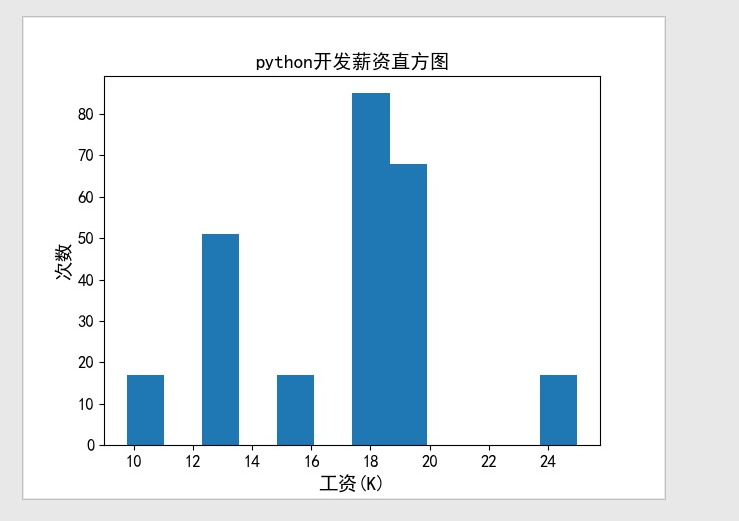
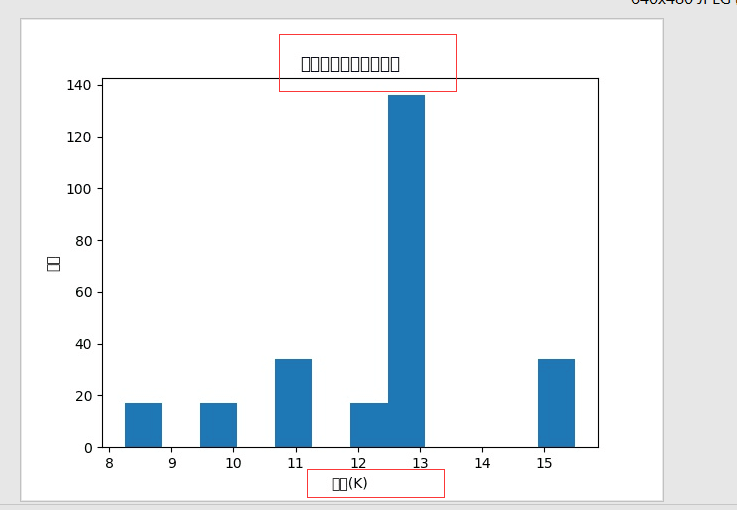
4.2直方图

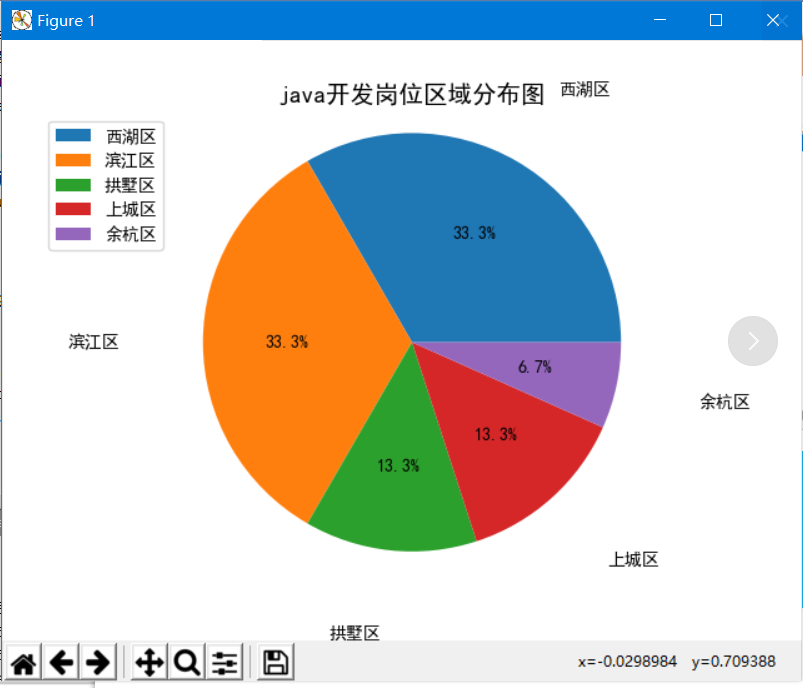
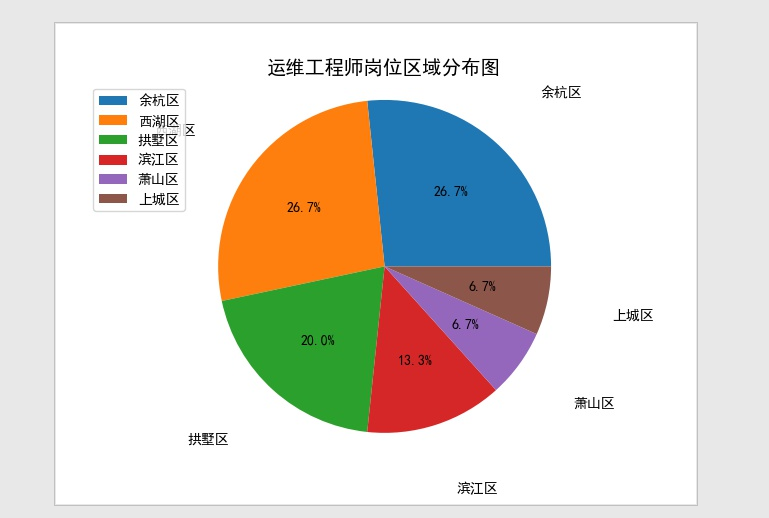
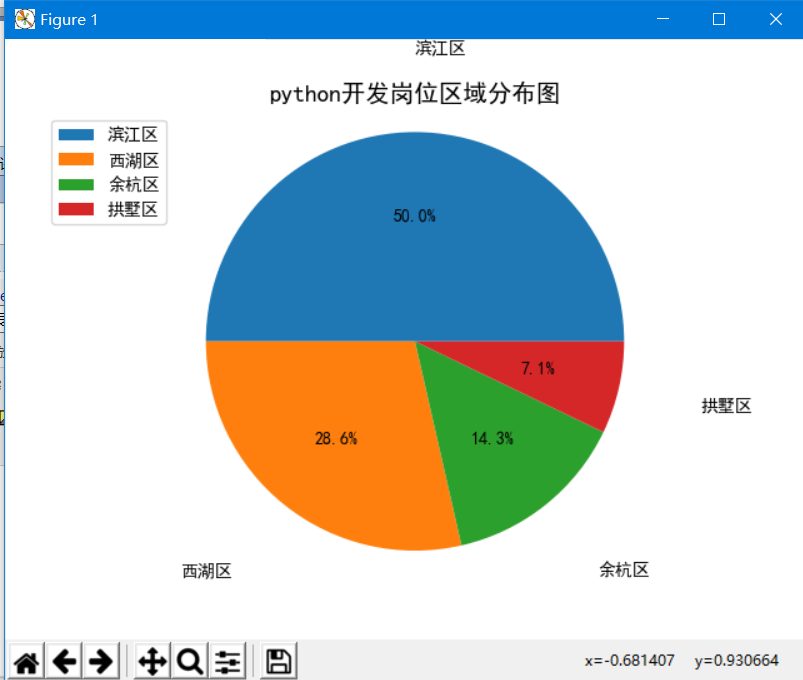
4.3饼图
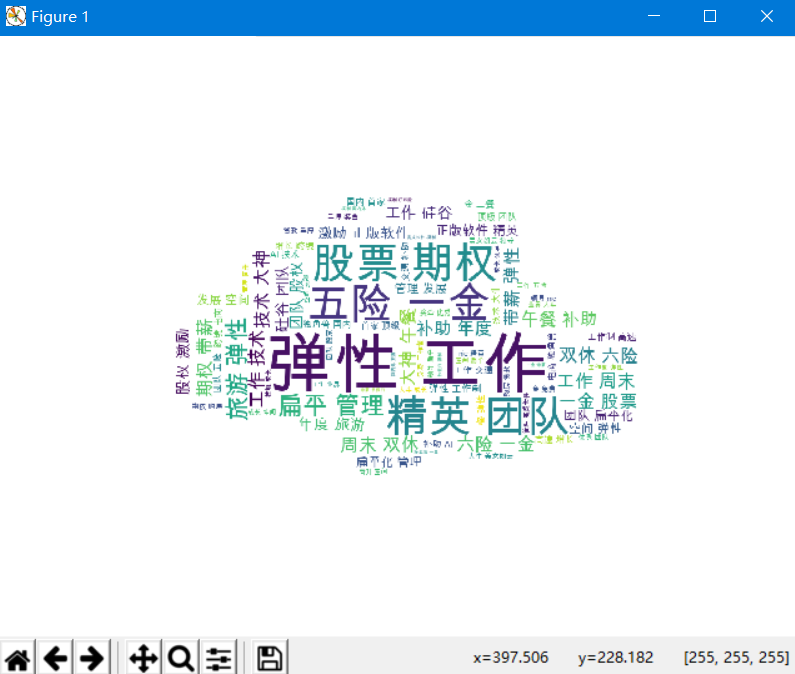
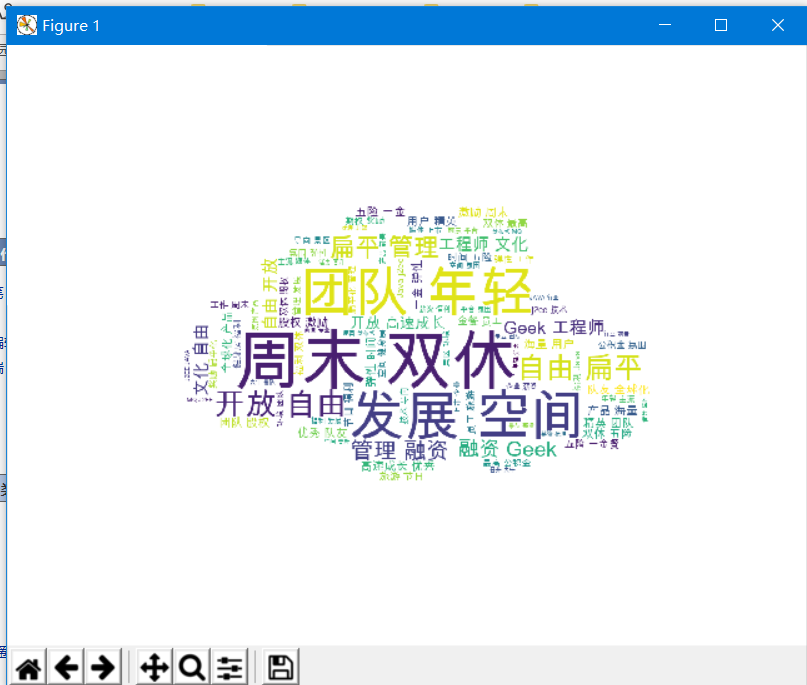
4.4词云图

5.填坑记
在生成词云的时候,由于没有将字体文件 Arial Unicode MS.ttf 放在当前工作目录中,导致生成词云图片一致失败且乱码。
OSError: cannot open resource
解决方法: 将ttf字体文件放在当前工作目录即可
matplotlib 画图乱码
UserWarning:
findfont: Font family ['sans-serif'] not found.
Falling back to DejaVu Sans
(prop.get_family(), self.defaultFamily[fontext]))
解决方法,复制一个windows字体目录下的 Arial Unicode MS.ttf 文件到matlib的包目录的ttf目录下
圈起来的部分根据自己环境更改。

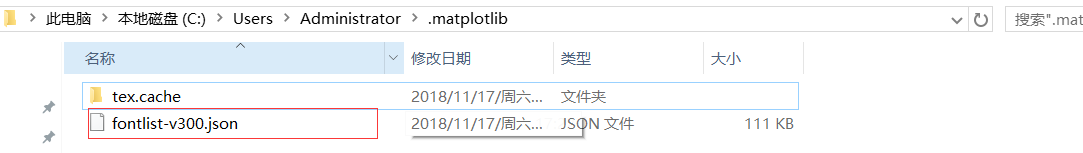
通过命令找到 matplotlib的配置目录

将这个json文件删除,他是一个字体的缓存文件,然后重新run脚本就会生成新的缓存文件。将刚刚复制过去的字体加载到缓存文件里。
不删除缓存文件重新生成的话,就会提示上面的报错 找不到那个字体。