有两种方式来监控logstash:
- api
- ui(xpack)
When you run Logstash, it automatically captures runtime metrics that you can use to monitor the health and performance of your Logstash deployment.
You can use the basic monitoring APIs provided by Logstash to retrieve these metrics. These APIs are available by default without requiring any extra configuration.
Alternatively, you can configure X-Pack monitoring to send data to a monitoring cluster.
1 api
Node Info API
The node info API retrieves information about the node.
# curl http://127.0.0.1:9600/_node?pretty
{
  "host" : "server-05",
  "version" : "6.5.4",
  "http_address" : "127.0.0.1:9600",
  "id" : "d9f6ac1d-26ab-442e-9353-c0fe3f0fe8cf",
  "name" : "server-05",
  "pipelines" : {
    "main" : {
      "workers" : 8,
      "batch_size" : 125,
      "batch_delay" : 50,
      "config_reload_automatic" : false,
      "config_reload_interval" : 3000000000,
      "dead_letter_queue_enabled" : false
    }
  },
  "os" : {
    "name" : "Linux",
    "arch" : "amd64",
    "version" : "3.10.0-957.5.1.el7.x86_64",
    "available_processors" : 8
  },
  "jvm" : {
    "pid" : 23133,
    "version" : "1.8.0_141",
    "vm_version" : "1.8.0_141",
    "vm_vendor" : "Oracle Corporation",
    "vm_name" : "Java HotSpot(TM) 64-Bit Server VM",
    "start_time_in_millis" : 1553667245630,
    "mem" : {
      "heap_init_in_bytes" : 536870912,
      "heap_max_in_bytes" : 518979584,
      "non_heap_init_in_bytes" : 2555904,
      "non_heap_max_in_bytes" : 0
    },
    "gc_collectors" : [ "ParNew", "ConcurrentMarkSweep" ]
  }
}
Plugins Info API
The plugins info API gets information about all Logstash plugins that are currently installed. This API basically returns the output of running the bin/logstash-plugin list --verbose command.
# curl http://127.0.0.1:9600/_node/plugins?pretty
{
  "host" : "server-05",
  "version" : "6.5.4",
  "http_address" : "127.0.0.1:9600",
  "id" : "d9f6ac1d-26ab-442e-9353-c0fe3f0fe8cf",
  "name" : "server-05",
  "total" : 99,
  "plugins" : [ {
    "name" : "logstash-codec-cef",
    "version" : "5.0.6"
  }, {
    "name" : "logstash-codec-collectd",
    "version" : "3.0.8"
  }, {
    "name" : "logstash-codec-dots",
    "version" : "3.0.6"
  },
...
Node Stats API
The node stats API retrieves runtime stats about Logstash.
# curl http://127.0.0.1:9600/_node/stats?pretty
{
  "host" : "server-05",
  "version" : "6.5.4",
  "http_address" : "127.0.0.1:9600",
  "id" : "d9f6ac1d-26ab-442e-9353-c0fe3f0fe8cf",
  "name" : "server-05",
  "jvm" : {
    "threads" : {
      "count" : 35,
      "peak_count" : 36
    },
    "mem" : {
      "heap_used_percent" : 50,
      "heap_committed_in_bytes" : 518979584,
      "heap_max_in_bytes" : 518979584,
      "heap_used_in_bytes" : 261155016,
      "non_heap_used_in_bytes" : 178053152,
      "non_heap_committed_in_bytes" : 218259456,
      "pools" : {
        "survivor" : {
          "peak_used_in_bytes" : 17891328,
          "used_in_bytes" : 8614928,
          "peak_max_in_bytes" : 17891328,
          "max_in_bytes" : 17891328,
          "committed_in_bytes" : 17891328
        },
        "old" : {
          "peak_used_in_bytes" : 163566944,
          "used_in_bytes" : 163566944,
          "peak_max_in_bytes" : 357957632,
          "max_in_bytes" : 357957632,
          "committed_in_bytes" : 357957632
        },
        "young" : {
          "peak_used_in_bytes" : 143130624,
          "used_in_bytes" : 88973144,
          "peak_max_in_bytes" : 143130624,
          "max_in_bytes" : 143130624,
          "committed_in_bytes" : 143130624
        }
      }
    },
    "gc" : {
      "collectors" : {
        "old" : {
          "collection_time_in_millis" : 151,
          "collection_count" : 2
        },
        "young" : {
          "collection_time_in_millis" : 11958,
          "collection_count" : 1255
        }
      }
    },
    "uptime_in_millis" : 1049304126
  },
  "process" : {
    "open_file_descriptors" : 103,
    "peak_open_file_descriptors" : 104,
    "max_file_descriptors" : 4096,
    "mem" : {
      "total_virtual_in_bytes" : 5936197632
    },
    "cpu" : {
      "total_in_millis" : 7796970,
      "percent" : 0,
      "load_average" : {
        "1m" : 0.0,
        "5m" : 0.04,
        "15m" : 0.05
      }
    }
  },
  "events" : {
    "in" : 9135,
    "filtered" : 9135,
    "out" : 9135,
    "duration_in_millis" : 11314,
    "queue_push_duration_in_millis" : 0
  },
  "pipelines" : {
    "main" : {
      "events" : {
        "duration_in_millis" : 11314,
        "in" : 9135,
        "out" : 9135,
        "filtered" : 9135,
        "queue_push_duration_in_millis" : 0
      },
      "plugins" : {
        "inputs" : [ {
          "id" : "0117e36c20fc4824ffb286255d03535acb0d462b00c0294651d48e2028315a6f",
          "events" : {
            "out" : 9135,
            "queue_push_duration_in_millis" : 0
          },
          "name" : "jdbc"
        } ],
        "filters" : [ ],
        "outputs" : [ {
          "id" : "791eb5d509a6269e6cbcbf1a8a6ffbbd12aab2924fee6e35fc70f79938534e76",
          "events" : {
            "duration_in_millis" : 10136,
            "in" : 9135,
            "out" : 9135
          },
          "name" : "kafka"
        }, {
          "id" : "3b968b786147f8809c823ca797ff6b78e60f6615794fc4716a0f52bb619bffc8",
          "events" : {
            "duration_in_millis" : 185,
            "in" : 9135,
            "out" : 9135
          },
          "name" : "stdout"
        } ]
      },
      "reloads" : {
        "last_error" : null,
        "successes" : 0,
        "last_success_timestamp" : null,
        "last_failure_timestamp" : null,
        "failures" : 0
      },
      "queue" : {
        "type" : "memory"
      }
    }
  },
  "reloads" : {
    "successes" : 0,
    "failures" : 0
  },
  "os" : {
    "cgroup" : {
      "cpuacct" : {
        "usage_nanos" : 58556486084501,
        "control_group" : "/system.slice/sshd.service"
      },
      "cpu" : {
        "cfs_quota_micros" : -1,
        "control_group" : "/system.slice/sshd.service",
        "stat" : {
          "number_of_times_throttled" : 0,
          "time_throttled_nanos" : 0,
          "number_of_elapsed_periods" : 0
        },
        "cfs_period_micros" : 100000
      }
    }
  }
}
Hot Threads API
The hot threads API gets the current hot threads for Logstash. A hot thread is a Java thread that has high CPU usage and executes for a longer than normal period of time.
# curl http://127.0.0.1:9600/_node/hot_threads?pretty
{
  "host" : "server-05",
  "version" : "6.5.4",
  "http_address" : "127.0.0.1:9600",
  "id" : "d9f6ac1d-26ab-442e-9353-c0fe3f0fe8cf",
  "name" : "server-05",
  "hot_threads" : {
    "time" : "2019-04-08T17:42:53+08:00",
    "busiest_threads" : 3,
    "threads" : [ {
      "name" : "Ruby-0-Thread-10",
      "thread_id" : 32,
      "percent_of_cpu_time" : 0.05,
      "state" : "timed_waiting",
      "path" : ":1",
      "traces" : [ "sun.misc.Unsafe.park(Native Method)", "java.util.concurrent.locks.LockSupport.parkNanos(LockSupport.java:215)", "java.util.concurrent.locks.AbstractQueuedSynchronizer$ConditionObject.awaitNanos(AbstractQueuedSynchronizer.java:2078)" ]
    }, {
      "name" : "Ruby-0-Thread-11",
      "thread_id" : 33,
      "percent_of_cpu_time" : 0.05,
      "state" : "timed_waiting",
      "path" : ":1",
      "traces" : [ "sun.misc.Unsafe.park(Native Method)", "java.util.concurrent.locks.LockSupport.parkNanos(LockSupport.java:215)", "java.util.concurrent.locks.AbstractQueuedSynchronizer$ConditionObject.awaitNanos(AbstractQueuedSynchronizer.java:2078)" ]
    }, {
      "name" : "Ruby-0-Thread-6",
      "thread_id" : 28,
      "percent_of_cpu_time" : 0.05,
      "state" : "timed_waiting",
      "path" : ":1",
      "traces" : [ "sun.misc.Unsafe.park(Native Method)", "java.util.concurrent.locks.LockSupport.parkNanos(LockSupport.java:215)", "java.util.concurrent.locks.AbstractQueuedSynchronizer$ConditionObject.awaitNanos(AbstractQueuedSynchronizer.java:2078)" ]
    } ]
  }
}
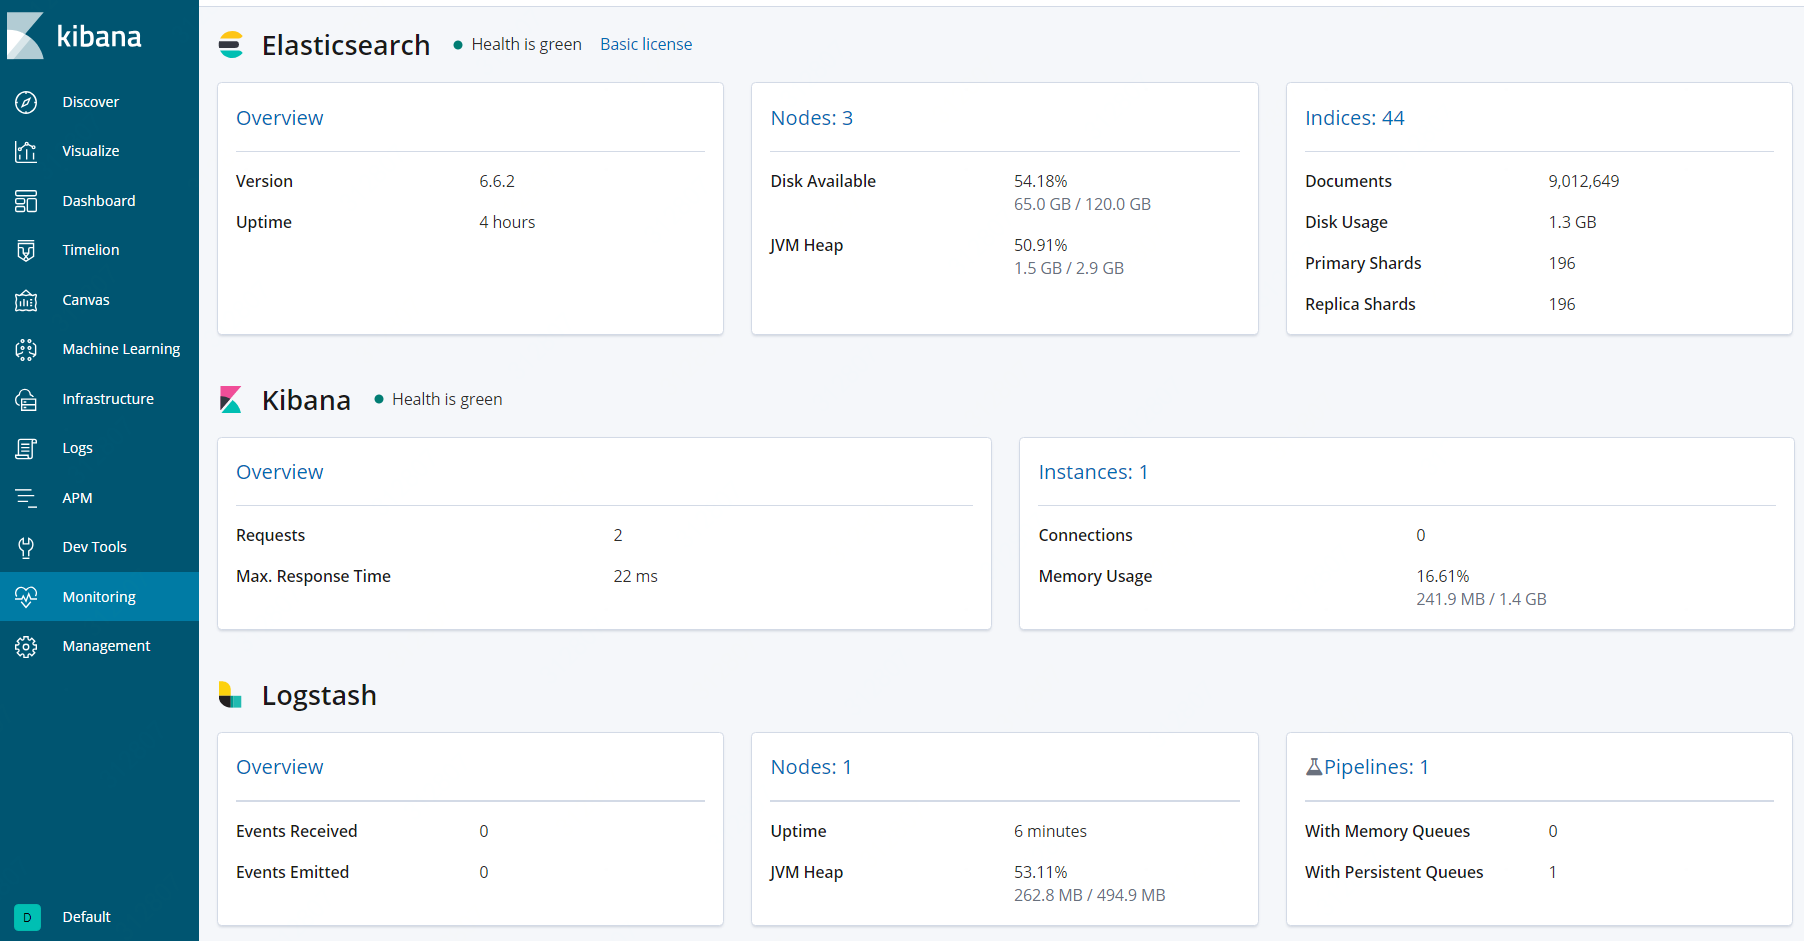
2 ui(xpack)
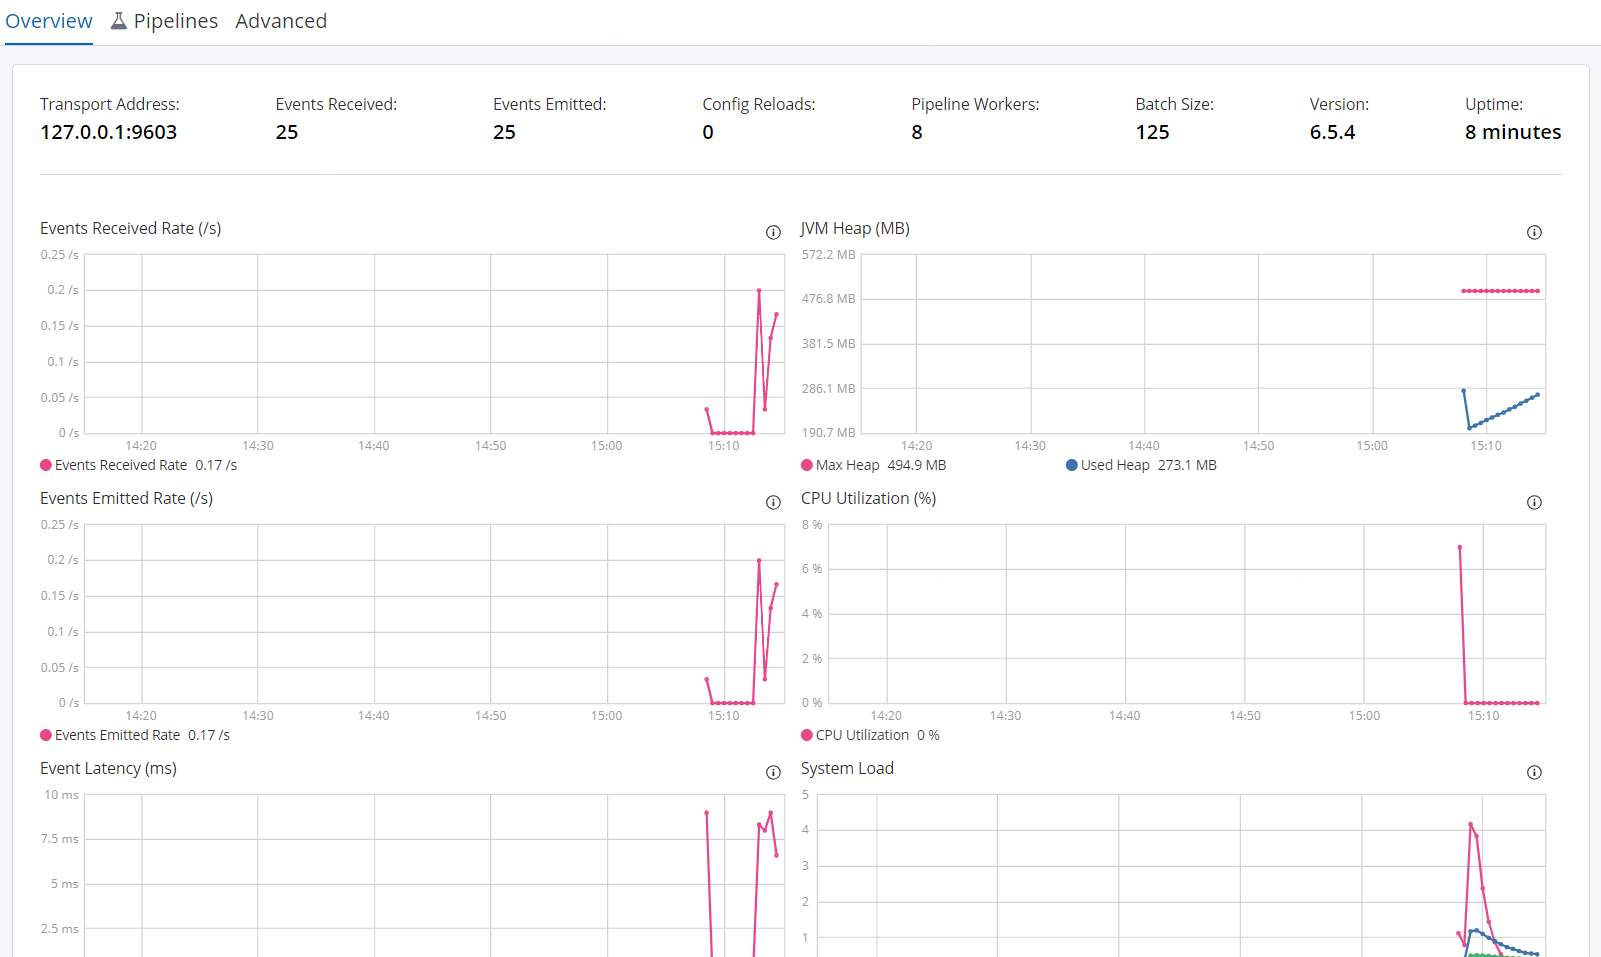
You can use the monitoring UI in X-Pack to view the metrics and gain insight into how your Logstash deployment is running.
Monitoring is an X-Pack feature under the Basic License and is therefore free to use.
The pipeline viewer in X-Pack offers additional visibility into the behavior and performance of complex pipeline configurations. It shows a graph representation of the overall pipeline topology, data flow, and branching logic, overlaid with important metrics, like events per second, for each plugin in the view.
配置
1)logstash
xpack.monitoring.enabled: true
xpack.monitoring.elasticsearch.hosts: ["http://es-prod-node-1:9200", "http://es-prod-node-2:9200"]
开启security或ssl会有更多配置
2)elasticsearch
xpack.monitoring.enabled: true
xpack.monitoring.collection.enabled: true
3)kibana
xpack.monitoring.enabled: true
Unlike X-Pack monitoring for Elasticsearch and Kibana, there is no xpack.monitoring.collection.enabled setting on Logstash. You must use the xpack.monitoring.enabled setting to enable and disable data collection.
kibana
A Logstash node is considered unique based on its persistent UUID, which is written to the path.data directory when the node starts.
参考:
https://www.elastic.co/guide/en/logstash/current/monitoring-logstash.html
https://www.elastic.co/guide/en/logstash/current/monitoring.html
https://www.elastic.co/guide/en/logstash/current/configuring-logstash.html
https://www.elastic.co/guide/en/logstash/current/logstash-monitoring-ui.html
https://www.elastic.co/guide/en/elasticsearch/reference/current/monitoring-settings.html
https://www.elastic.co/guide/en/kibana/current/monitoring-settings-kb.html