一.Elasticsearch 安装(所有的版本均使用5.5.0 ,且版需要相同 logstash kibana filebeat )
官网下载地址:https://www.elastic.co/cn/
(下载Linux版),上传到本地虚拟机服务器 ,tar -zxvf 解压,运行
遇到的问题1 : 不允许 root 用户启动
解决:
adduser  test
passwd   test
chown -R  test  文件根目录
遇到的问题2:
max file descriptors [4096] for elasticsearch process likely too low, increase to at least [65536]
max number of threads [1024] for user [lishang] likely too low, increase to at least [2048]
解决:(切记,添加完退出登陆,再登陆,否则不会生效)
vim    /etc/security/limits.conf
添加如下内容:

*     soft     nofile     65536

*     hard     nofile     131072

*     soft     nproc     2048

*     hard     nproc     4096
遇到的问题3:
max number of threads [1024] for user [lish] likely too low, increase to at least [2048]
解决:
vim     /etc/security/limits.d/90-nproc.conf
修改或者添加下:
*     soft     nproc     2048
遇到的问题4:
max virtual memory areas vm.max_map_count [65530] likely too low, increase to at least [262144]
解决:
vim     /etc/sysctl.conf
添加
vm.max_map_count=655360
退出执行
sysctl -p
遇到的问题5:
再虚拟机中 127.0.0.1:9200 成功 , 外部 :虚拟机 ip:9200 失败
解决:
在conf 文件下添加:
net.host: 虚拟机IP
最后:在主机
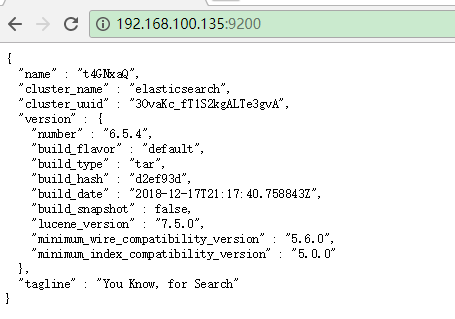
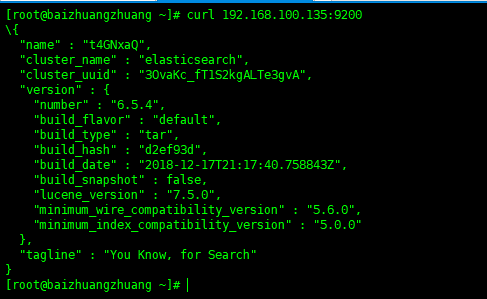
在虚拟机:
二、安装 kibana (数据展示)
在elasticsearch.org 官网有一系列的软件可以下载,下载5.5.0版本的 kibana
解压同elasticsrarch 上
修改配置:/kibana/config/kibana.yml
server.host:"0.0.0.0"

elasticsearch.url : "http://localhost:9200"
启动 kibana
./bin/kibana
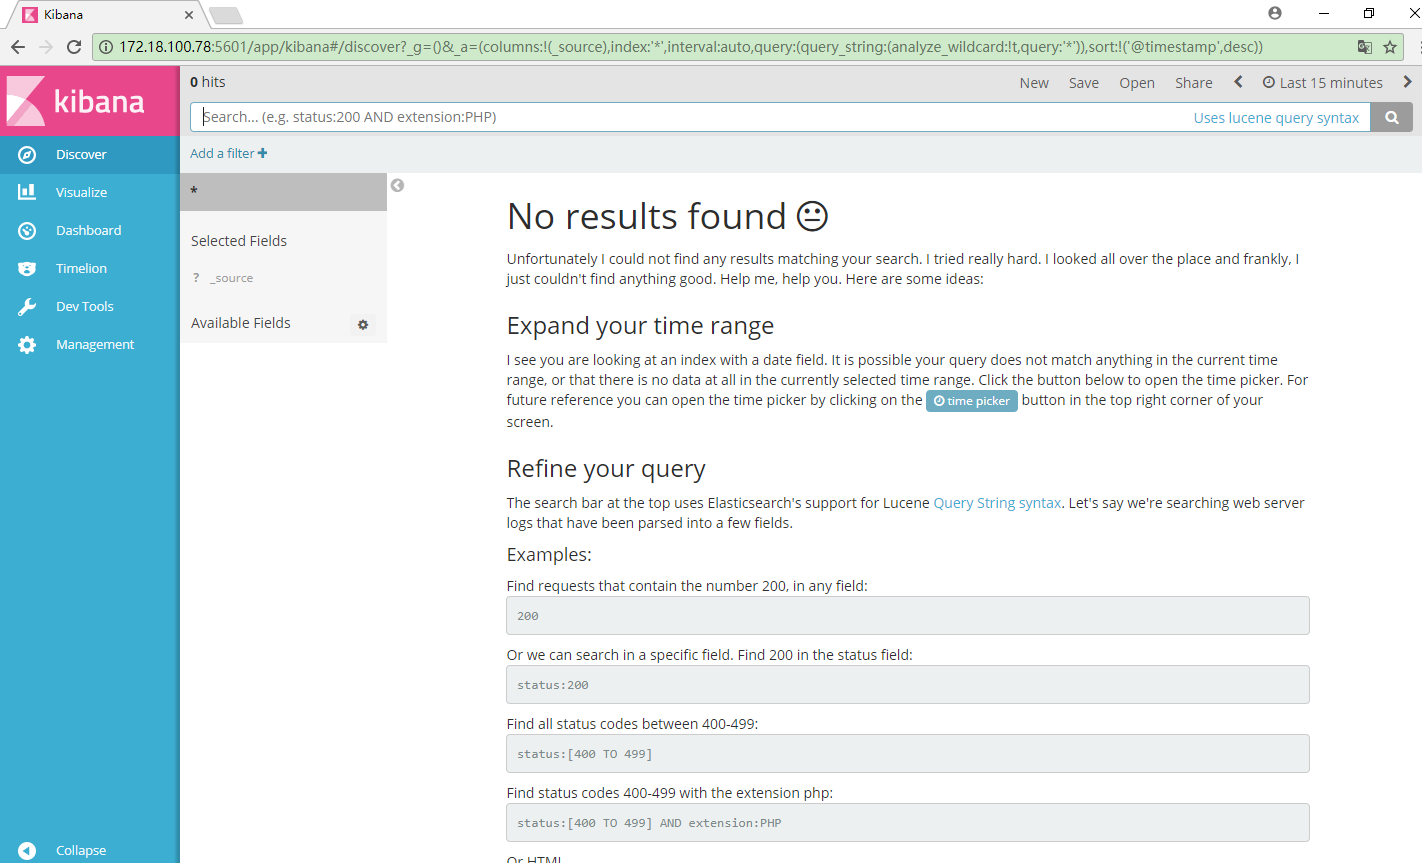
浏览器访问:服务器ip:5601
三、logstash 安装启动
下载解压同上,配置区别较大
1.在logstash 根目录下建立 logstash.conf 目录,内容包括如下
input {
        beats{
                port => 5044
        }
}

filter{
}

output {
        elasticsearch{
                hosts => ["172.18.100.78:9200"]
                index => "tomcat_ctmpweb_%{+YYYY.MM.dd}"
        }
        stdout{
                codec =>rubydebug
        }
}
~
其中 input 为输入数据端,此处设置数据来源为 filebeat 搜集,稍后配置
输出数据为 elasticsearch
启动 logstash
bin/logstash -f nginx_logs.conf
四、安装启动 filebeat
下载,解压,配置 filebeat.yml
1.配置日志文件读取路径

2.(默认输出到elasticsearch ),注释掉elasticsearch,开放 logstash

3.启动 filebeat
./filebeat -e -c filebeat.yml -d "publish"
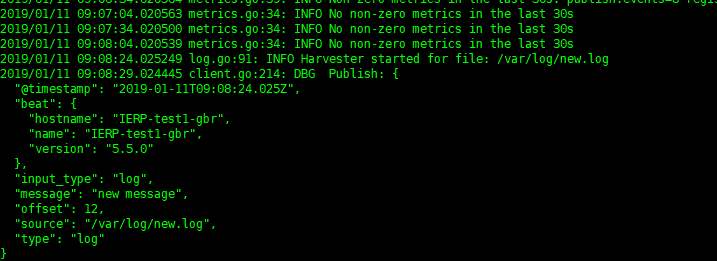
五、分析日志
在监听的日志文件中加入new.log ,当有新的日志加入,会及时分析如下
若想要重新开始扫描日志,删掉filebeat 目录下data目录中的数据,则filebeat 会重新扫描
