NumPy(Numerical Python)是Python中科学计算的基础包。
它是一个Python库,提供多维数组对象,各种派生对象(如掩码数组和矩阵),以及用于数组快速操作的各种API,有包括数学、逻辑、形状操作、排序、选择、输入输出、离散傅立叶变换、基本线性代数,基本统计运算和随机模拟等等。
NumPy的主要对象是同构多维数组。
它是一个元素表(通常是数字),所有类型都相同,由非负整数元组索引。
在NumPy维度中称为轴
numpy提供了python对多维数组对象的支持:ndarray
ndarray对象的属性
ndarray.ndim - 数组的轴(维度)的个数
ndarray.shape - 数组的维度
ndarray.size - 数组元素的总数
ndarray.dtype - 一个描述数组中元素类型的对象
ndarray.itemsize - 数组中每个元素的字节大小
eg:
>>> import numpy as np
>>> a=np.arange(12).reshape(3,4)
>>> a
array([[ 0,  1,  2,  3],
       [ 4,  5,  6,  7],
       [ 8,  9, 10, 11]])
>>> a.shape
(3, 4)
>>> a.ndim
2
>>> a.dtype.name
'int32'
>>> a.itemsize
4
>>> a.size
12
>>> type(a)
<class 'numpy.ndarray'>
数组创建
>>> b = np.array([2,3,4])
>>> b
array([2, 3, 4])
>>> b.dtype
dtype('int32')
>>> c=np.array([1.2,2.3,3.4])
>>> c.dtype
dtype('float64')
>>> d=np.array([(1.2,2,3),(4,5,6)])
>>> d
array([[1.2, 2. , 3. ],
       [4. , 5. , 6. ]])
>>> e=np.array([[1,2],[4,5]],dtype=complex)
>>> e
array([[1.+0.j, 2.+0.j],
       [4.+0.j, 5.+0.j]])
索引、切片
>>> a
array([  0,   1,   8,  27,  64, 125, 216, 343, 512, 729], dtype=int32)
>>> a[2]
8
>>> a[2:5]
array([ 8, 27, 64], dtype=int32)
>>> a[:6:2]=-1000
>>> a
array([-1000,     1, -1000,    27, -1000,   125,   216,   343,   512,
         729], dtype=int32)
>>> a[ : :-1]
array([  729,   512,   343,   216,   125, -1000,    27, -1000,     1,
       -1000], dtype=int32)

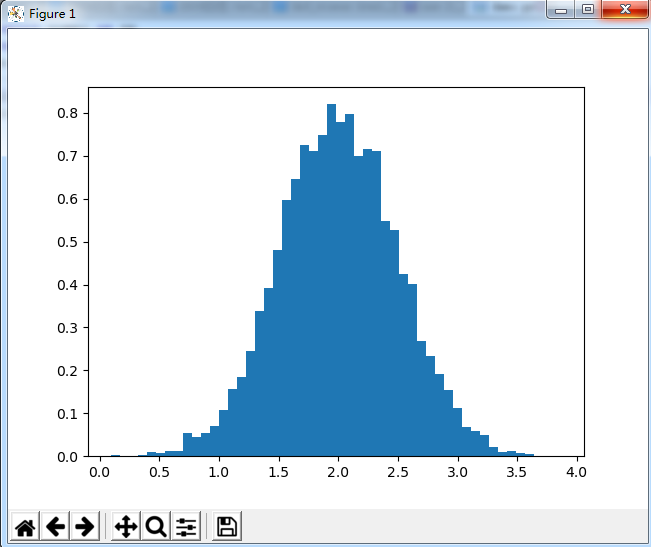
与matplotlib构建直方图
import numpy as np
import matplotlib.pyplot as plt
mu, sigma = 2, 0.5
v = np.random.normal(mu,sigma,10000)
plt.hist(v, bins=50, density=1)
plt.show()
pylab.hist自动绘制直方图
numpy.histogram只生成数据
import numpy as np
import matplotlib.pyplot as plt
mu, sigma = 2, 0.5
v = np.random.normal(mu,sigma,10000)
(n, bins) = np.histogram(v, bins=50, density=True)
plt.plot(.5*(bins[1:]+bins[:-1]), n)
plt.show()
