在对数据进行可视化的过程中,可能经常需要对数据进行三维绘图,在python中进行三维绘图其实是比较简单的,下面我们将给出一个二元高斯分布的三维图像案例,并且给出相关函数的参数。
通常,我们绘制三维图像经常需要如下步骤:
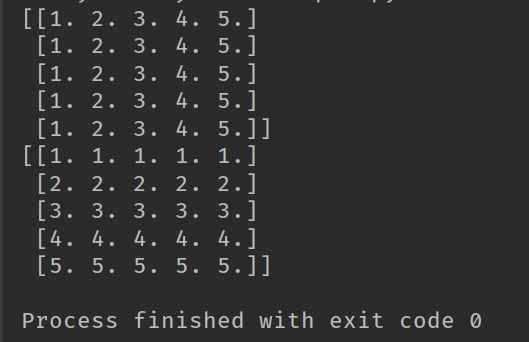
1.生成二维的网格坐标数据,我们可以使用np.meshgrid(x, y)函数进行二维网格坐标的生成,该函数通过传入的参数生成两个坐标的网格数据,并且返回的数据具有如下的格式:
import numpy as np

t = np.linspace(1, 5, 5)
x, y = np.meshgrid(t,t)
print(x)
print(y)

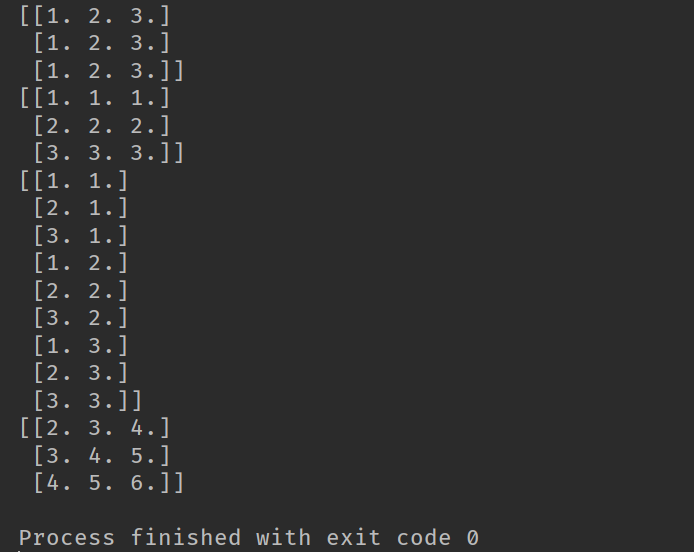
2.通过网格坐标,生成z轴上的网格坐标。得到了x,y的网格数据之后,我们需要根据x,y的数据的到z的网格数据,我们可以通过迭代将x,y进行拼接,形成列数为2的矩阵,并通过矩阵计算z的数据,计算之后,在将z的数据维度进行转换,得到z的网格数据。
xy = np.stack([x.flat, y.flat], axis=1)
print(xy)
xy = np.stack([x.flat, y.flat], axis=1)
print(xy)
z = xy[:, 0] + xy[:, 1]
z = np.array(z)
z = z.reshape(x.shape)
print(z)


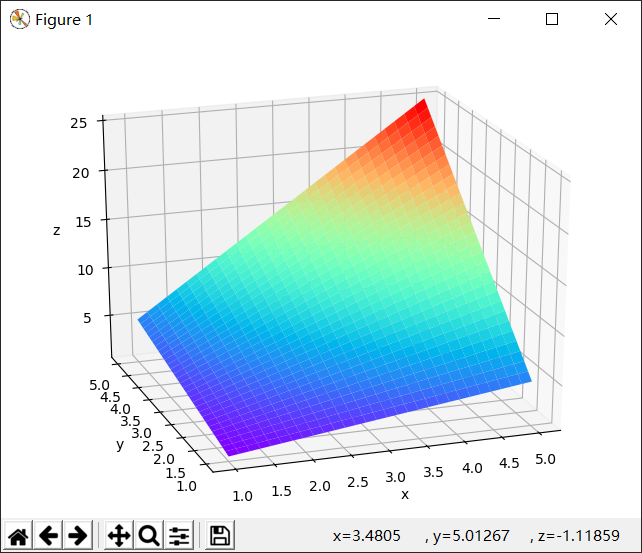
3.获取绘制3维图像的句柄,调用相关函数进行绘制,绘制3维图面ax.plot_surface(x, y, z, cmap='rainbow', rstride=1, cstride=1),绘制3维曲线ax.scatter(),参数类似前者。
import numpy as np
from mpl_toolkits.mplot3d import Axes3D
import matplotlib.pyplot as plt

fig = plt.figure()
ax = Axes3D(fig)
ax.plot_surface(x, y, z, cmap='rainbow', rstride=1, cstride=1)
ax.set_xlabel("x")
ax.set_ylabel("y")
ax.set_zlabel("z")
4.基本上很多的绘图思路都如上,比如绘制一些分类器的分类区域图。
import numpy as np
from mpl_toolkits.mplot3d import Axes3D
import matplotlib.pyplot as plt

fig = plt.figure()
ax = Axes3D(fig)

t = np.linspace(1, 5, 30)
x, y = np.meshgrid(t,t)
print(x)
print(y)
xy = np.stack([x.flat, y.flat], axis=1)
print(xy)
z = xy[:, 0] * xy[:, 1]
z = np.array(z)
z = z.reshape(x.shape)
print(z)
ax.plot_surface(x, y, z, cmap='rainbow', rstride=1, cstride=1)
ax.set_xlabel("x")
ax.set_ylabel("y")
ax.set_zlabel("z")
plt.show()

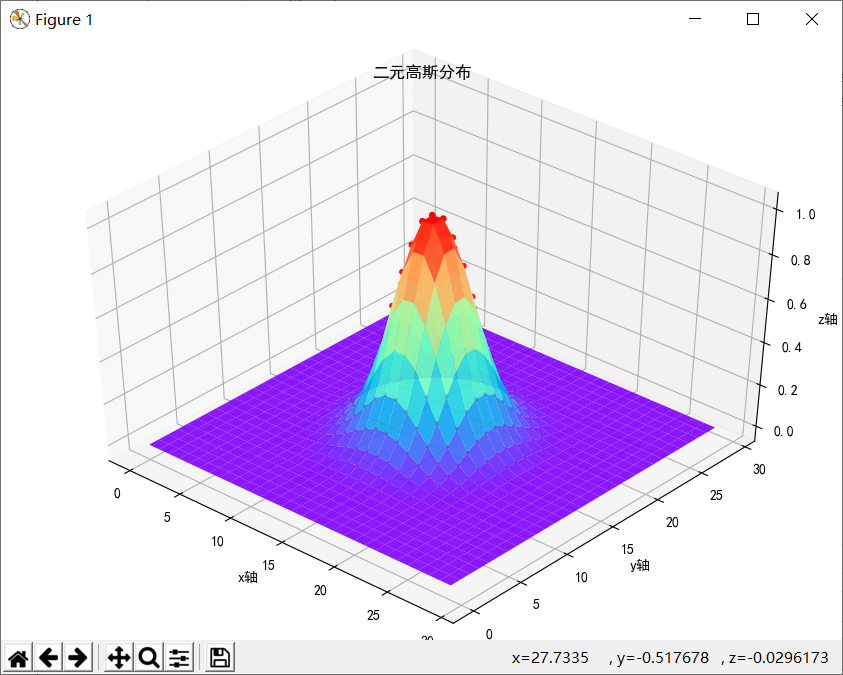
5.绘制二元高斯分布3维图
import numpy as np
import matplotlib.pyplot as plt
from mpl_toolkits.mplot3d import Axes3D
import matplotlib as mpl

if __name__ == '__main__':
    mpl.rcParams['font.sans-serif'] = ['SimHei']
    mpl.rcParams['axes.unicode_minus'] = False

    d = np.random.randn(10000000, 2)
    N = 30
    density, edges = np.histogramdd(d, bins=[30, 30])
    print("样本总数: ", np.sum(density))
    density = density/density.max()
    x = y = np.arange(N)
    t = np.meshgrid(x,y)
    fig = plt.figure()
    ax = Axes3D(fig)
    ax.scatter(t[0], t[1], density, c='r', s=15*density, marker='o', depthshade=True)
    ax.plot_surface(t[0], t[1], density, cmap='rainbow', rstride=1, cstride=1, alpha=0.9, lw=1)
    ax.set_xlabel("x轴")
    ax.set_ylabel("y轴")
    ax.set_zlabel("z轴")
    plt.title("二元高斯分布")
    plt.tight_layout(0.1)
    plt.show()

