需求
使用Python对时间序列的(x, y)观测点集进行等间隔线性插值,希望得到[(x0, y0), (x1, y1), ...]点集输出。
查阅
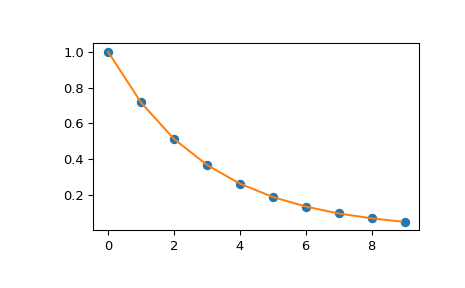
使用SciPy提供的interp1d方法,先看个官方示例:
>>> import matplotlib.pyplot as plt
>>> from scipy import interpolate
>>> x = np.arange(0, 10)
>>> y = np.exp(-x/3.0)
>>> f = interpolate.interp1d(x, y)
>>> xnew = np.arange(0, 9, 0.1)
>>> ynew = f(xnew)   # use interpolation function returned by `interp1d`
>>> plt.plot(x, y, 'o', xnew, ynew, '-')
>>> plt.show()

清晰明了,是否支持多维度插值呢?
class scipy.interpolate.interp1d(x, y, kind='linear', axis=- 1, ...)
Parameters:
x(N,) : array_like
  A 1-D array of real values.
y(…,N,…) : array_like
  A N-D array of real values. The length of y along the interpolation axis must be equal to the length of x.
axis : int, optional
Specifies the axis of y along which to interpolate. Interpolation defaults to the last axis of y.
看来只要只需构造合适的输入y矩阵,满足沿指定axis维度和输入x维度相等即可。
实现
修改代码如下
import matplotlib.pyplot as plt
from scipy import interpolate
import numpy as np
t = np.arange(0, 10)
x = np.exp(-t / 3.0)
y = np.sin(3 * t)
a = np.array([x,y])
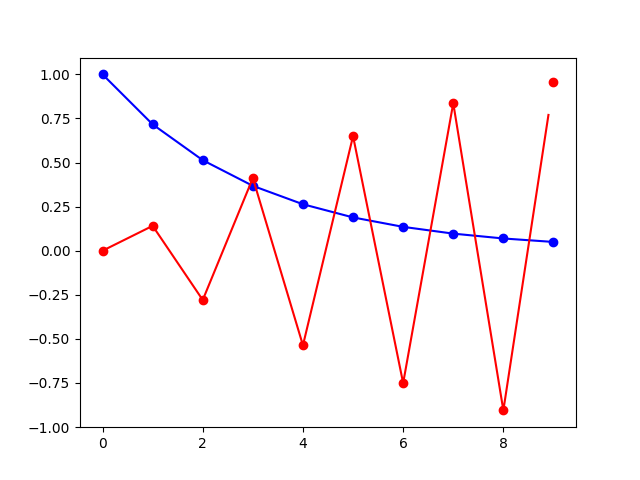
f = interpolate.interp1d(t, a)
tnew = np.arange(0, 9, 0.1)
xnew,ynew = f(tnew)
plt.plot(t, x, 'bo', t, y, 'ro', tnew, xnew ,'b-', tnew, ynew, 'r-')
plt.show()

注意:如果输入点集为[(x0, y0), (x1, y1), ...]格式则需要手动指定axis = 0且输出格式也为[(x0, y0), (x1, y1), ...]格式